|
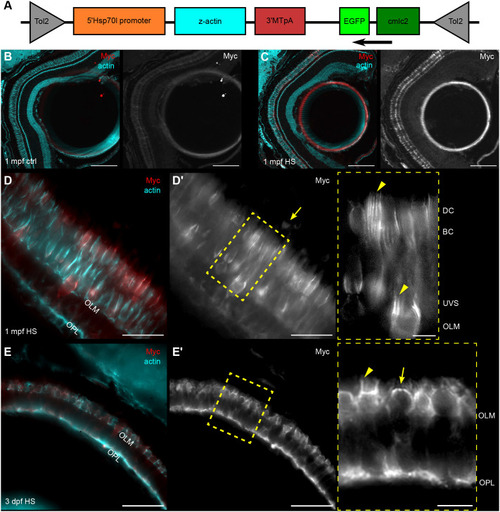
Induced actin is incorporated into CP cores in zebrafish. (A) Diagram representing various components of the construct injected into one-cell stage WT embryos. Arrow indicates direction of transcription for EGFP. (B–E) Micrographs of Tg(hsp:act-myc) zebrafish retina stained with phalloidin (cyan) and anti-Myc (red) antibody. (B) Control 1 mpf Tg(hsp:act-myc) eye. (C) Eye of 1 mpf Tg(hsp:act-myc) fish 24 h after heat shock (HS). (D,D′) Higher magnification of the photoreceptor layer of a heat-shock-treated 1 mpf fish; arrow in D′ points at a rod IS; inset shows enlarged yellow box contents from D′, arrowheads highlight Myc localization to CPs. (E) 3 dpf Tg(hsp:act-myc) embryo 6 h after heat shock. (E′) Yellow box indicates position of enlarged area in the inset. Actin–Myc expression is in the IS actin dome (arrow) and in the CPs (arrowhead). Number of fish analysed: n=11 (B), n=12 (C), n=7 (D), n=11 (E). Scale bars: 100 µm (B,C), 20 µm (D–E′, main images), 5 µm (D′,E′, insets).
|