IMAGE

Fig. 3.

ID
ZDB-IMAGE-240501-20
Source
Figures for Sharkova et al., 2024
Image
Figure Caption

Fig. 3.

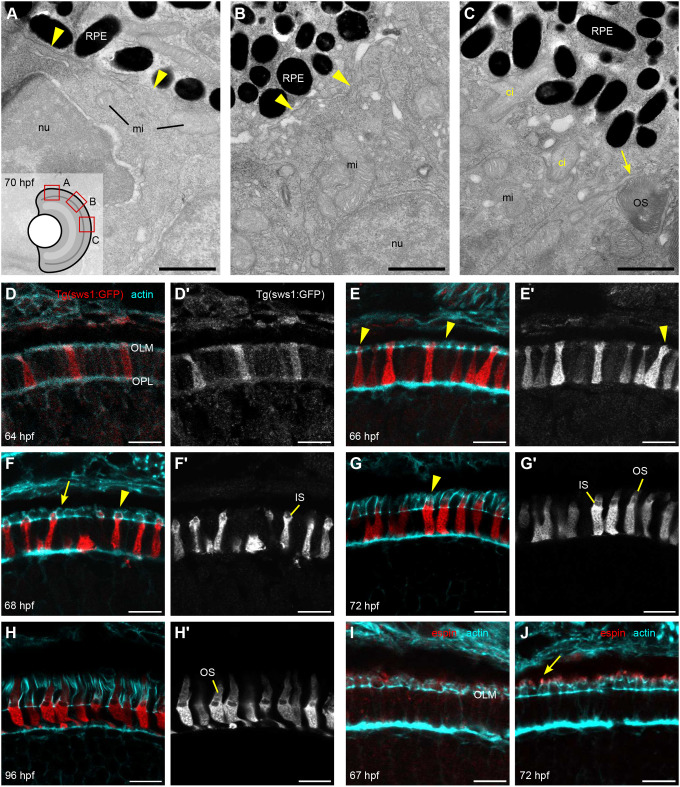
Details of IS, OS, and CP development in zebrafish retina. (A–C) TEM micrographs depicting the progression of IS and OS development in 70 hpf wild-type embryonic retinas. A small schematic inset in A shows the approximate position of each panel. (A) In the peripheral retina, the photoreceptor–RPE interface is flat, with an isolated apical photoreceptor process extending parallel to the interface, as indicated by arrowheads. mi, mitochondria; nu, nucleus. (B) When moving away from the periphery, processes (arrowheads) can be observed emerging from both the RPE and photoreceptor apical surfaces, creating an interdigitating IS–RPE interface. (C) In the dorsocentral region, one photoreceptor has an OS with well-developed discs and a visible adjacent CP (arrow), while two other photoreceptors are at the emerging cilium (ci) stage. (D–H) Confocal images of Tg(sws1:GFP) (red) outer retina sections at 64, 66, 68, 72, and 96 hpf stained with phalloidin (cyan). (D) Early photoreceptors with columnar morphology and an actin-rich apical domain, but no distinct ISs. (E) Arrowheads point at actin dome-like structure in the IS. (E′) Filopodia emerging from IS apical surface (arrowhead). (F) Different IS and actin dome shapes: round and rectangular (arrow and arrowhead, respectively). (G) Arrowhead indicates CPs. (I,J) Confocal images of 67 and 72 hpf outer retina sections stained with phalloidin (cyan) and anti-espin (red). (J) An arrow highlights espin localization to the CPs in 72 hpf fish. Number of fish analysed: n=3 (A–C), n=7 (D), n=5 (E), n=8 (F,G), n=6 (H), n=4 (I,J). Scale bars: 1 µm (A–C), 10 µm (D–J).

Acknowledgments
This image is the copyrighted work of the attributed author or publisher, and ZFIN has permission only to display this image to its users. Additional permissions should be obtained from the applicable author or publisher of the image. Full text @ J. Cell Sci.