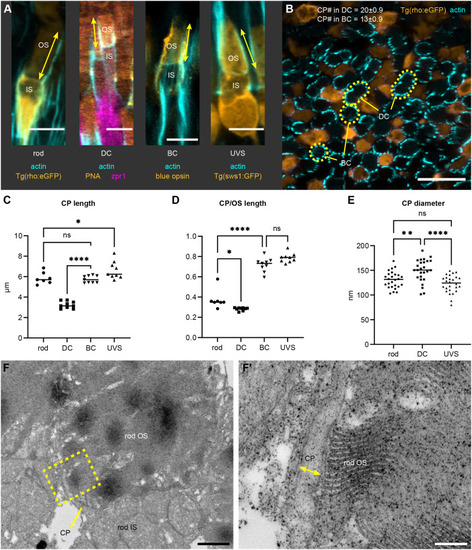
CP parameters for photoreceptor subtypes in the juvenile zebrafish retina. (A) Confocal images of 1 mpf retinas stained with phalloidin (cyan). Shown are a dark-adapted rod [DA; Tg(rho:eGFP)], light-adapted double cone (DC) [LA wild-type (WT) stained with PNA and zpr1], blue cone (BC) (LA WT stained with anti-blue opsin) and UV-sensitive cone (UVS) [LA Tg(sws1:GFP)]; CP length is indicated by arrows. (B) Sagittal section through a 1 mpf DA Tg(rho:eGFP) retina (rods in orange) labelled with phalloidin (cyan). BC and DC OSs are outlined. For CP number, mean±s.d. are shown; n=5 fish. (C,D) Graphs displaying CP length (C) and CP length relative to the OS length (D) for LA DC, LA BC, LA UVS cones, and DA rods; number of fish n=9 (DC, BC, UVS), n=7 (rod). (E) Graph showing CP diameter measured in rods, DC, and UVS cones in TEM images of 1 mpf WT retina, with individual measurements plotted; number of fish n=5. In C–E, the line highlights the median. ns, not significant (P>0.05), *P<0.05, **P<0.01, ****P<0.0001 (one-way ANOVA with Tukey's test). (F) Example of TEM imaging used for measuring CP diameter. Lower magnification image showing the rod OS, IS and a CP, with a yellow contour indicating the area in F′, where CP diameter is labelled. Scale bars: 5 µm (A), 10 µm (B), 1 µm (F), 200 nm (F′).
|
