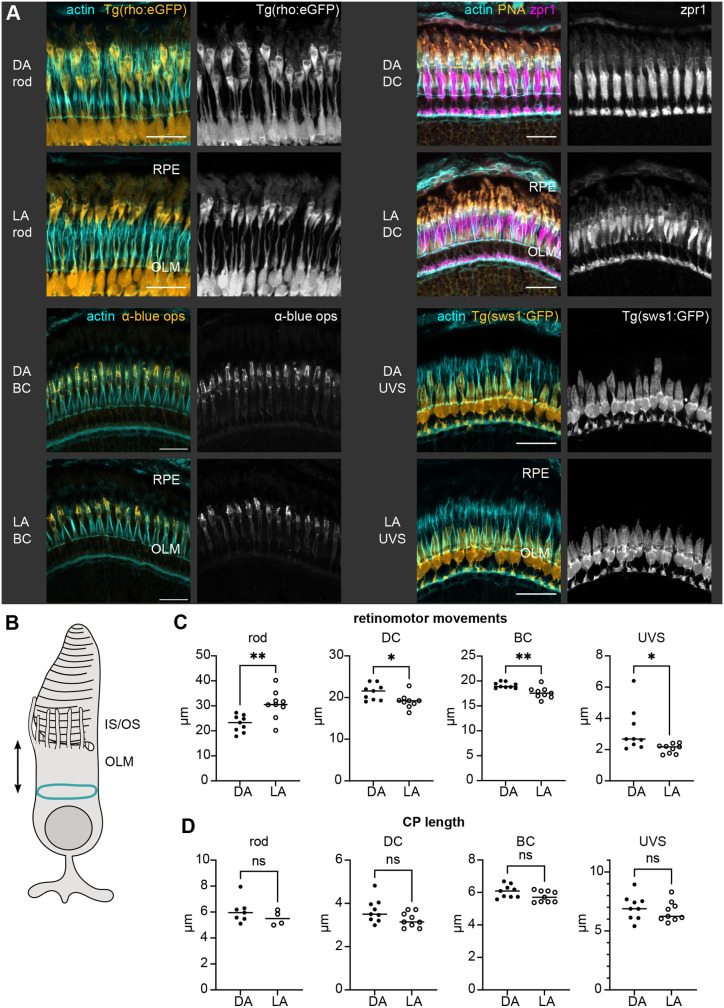
IMAGE

Fig. 2.

ID
ZDB-IMAGE-240501-19
Source
Figures for Sharkova et al., 2024
Image
Figure Caption

Fig. 2.

Retinomotor movements and CP length in dark-adapted and light-adapted 1 mpf zebrafish retina. (A) Confocal images of 1 mpf DA and LA outer retina sections stained with phalloidin (cyan). From left to right, top to bottom: rods (Tg(rho:eGFP)), double cones (DC) [wild-type (WT) stained with PNA and zpr1], blue cones (BC) (WT stained with anti-blue opsin), UV-sensitive cones (UVS) [Tg(sws1:GFP)]. Scale bars: 20 µm. (B) Schematic depiction of measurement for the IS–OLM distance. (C) Graphs showing the extent of cellular retinomotor movements as the distance between the apical IS and the OLM in each photoreceptor cell type for DA versus LA state. (D) Graphs displaying the CP length in photoreceptors in DA versus LA fish. Statistics: number of fish n=9 (rods, DC, BC, UVS), n=7 (rod DA CP length), n=4 (rod LA CP length); the line highlights the median. ns, not significant (P>0.05), *P<0.05, **P<0.01 (two-tailed unpaired t-tests with Welch's correction).

Acknowledgments
This image is the copyrighted work of the attributed author or publisher, and ZFIN has permission only to display this image to its users. Additional permissions should be obtained from the applicable author or publisher of the image. Full text @ J. Cell Sci.