
- Title
-
Targeting CD38/cyclic ADP-ribosyl cyclase as a novel therapeutic strategy for identification of three potent agonists for leukopenia treatment
- Authors
- Liu, Y., Zhang, L., Wang, L., Tang, X., Wan, S., Huang, Q., Ran, M., Shen, H., Yang, Y., Chiampanichayakul, S., Tima, S., Anuchapreeda, S., Wu, J.
- Source
- Full text @ Pharmacol. Res.
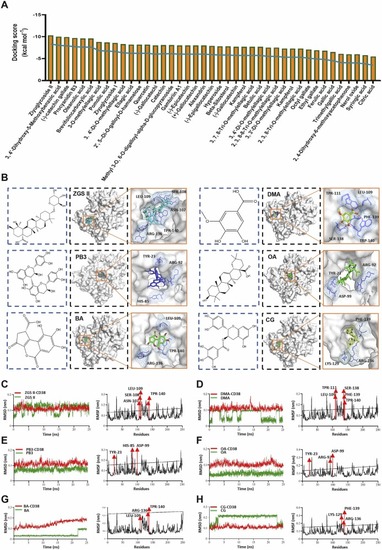
Model construction of virtual screening and discovery of candidate compounds. (A) Prediction score of 41 compounds of Sanguisorba officinalis L. binding with the ADP ribosyl cyclase structure of CD38. (B) Molecular docking simulation reveals the interaction between compounds (ZGSⅡ, DMA, CG, PB3, OA, BA) and the ADP ribosyl cyclase structure of CD38. (C-H) The RMSD and RMSF values were obtained for the ADP ribosyl cyclase structure complexed with ZGSⅡ, DMA, CG, PB3, OA, and BA, respectively. |
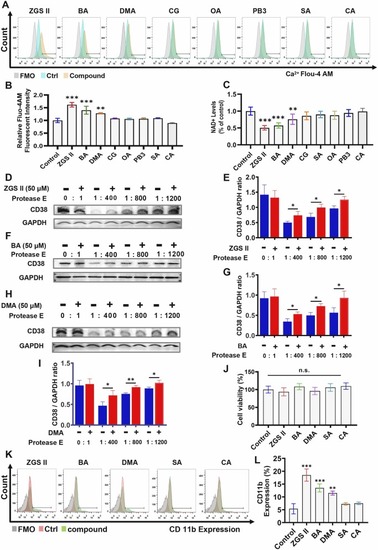
Identification of compounds that positively target the ADP ribosyl cyclase of CD38. (A) Flow cytometry analysis of intracellular Ca2+ expression in NB4 cells treated with 10 μM of each compound, including ZGSⅡ, CG, OA, PB3, BA, DMA, SA, and CA for 5 days. DMSO was used as a vehicle control. Negative control: the SA-treated group and the CA-treated group. (B) Quantification (mean fluorescent intensity, MFI) of intracellular Ca2+ as indicated by Fluo-4 AM staining in NB4 cells. (C) The expression of NAD+ in NB4 cells with different treatments for 5 days. Data represent the mean ± SD of three independent experiments. * * P < 0.01, and * **P < 0.001, versus the control groups; (one-way analysis of variance) (D-I) The DARTS assay indicates the binding between positive compounds (10 μM ZGSⅡ, DMA, and BA) and CD38 protein. Data represent the mean ± SD of three independent experiments. * * P < 0.01, and * **P < 0.001, versus the corresponding control groups; (student’s unpaired two-tailed t-test) (J) Proliferation assay. CCK-8 assay for NB4 cell proliferation after treatment with 10 μM ZGSⅡ, BA, and DMA for 4 days. (K, L) Flow cytometry analysis (K) and quantification (L) of CD11b expression after NB4 cells were treated with 10 μM ZGSⅡ, DMA, BA, SA, and CA for 5 days. Data represent the mean ± SD of three independent experiments. * * P < 0.01, and * **P < 0.001, versus the control group (one-way analysis of variance); n.s.= no significance. |
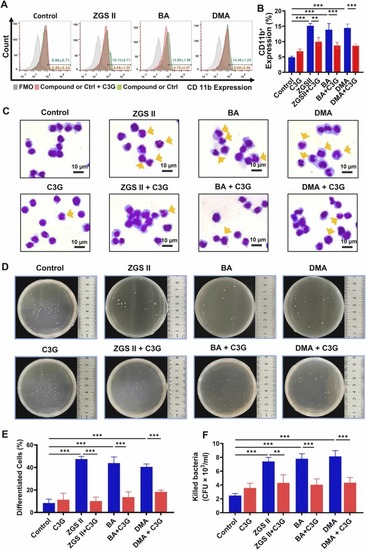
The activity of ADP ribosyl cyclase is implicated in myeloid differentiation and bactericidal activity induced by ZGSII, BA, and DMA. (A) Effects of ZGSⅡ (10 μM), BA (10 μM), DMA (10 μM), or C3G (40 μM) on CD11b expression after 5 days of treatments. (B) The histogram shows the percentage of CD11b+ cells for each group. (C) Giemsa-Wright staining of NB4 cells treated with ZGSⅡ, DMA, BA, or C3G for 5 days. Yellow arrows represent differentiated NB4 cells. Bars = 10 µm. (D) Bactericidal activity evaluation. The cells were treated with ZGSⅡ, BA, DMA, or C3G for 5 days, followed by a bacterial killing assay. (E, F) The histograms display the percentage of differentiated NB4 cells (E) and the number of killed bacteria (F) for each group. The data are presented as the mean ± SD of three independent experiments. *p < 0.05; * *p < 0.01; * **p < 0.001 versus the corresponding control groups (one-way analysis of variance). |
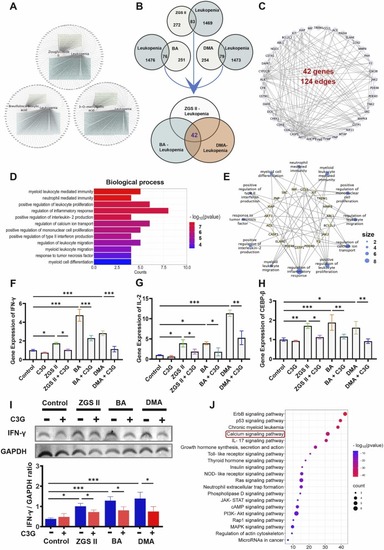
Targets identification of ZGS II, BA, and DMA against leukopenia through network pharmacology. (A) ZGSII/BA/DMA-leukopenia-target networks. (B) Common targets of the compounds (ZGSII, BA, DMA) and leukopenia. (C) Protein-protein interaction (PPI) network of the bioactive compounds against leukopenia. (D) The top 12 biological processes of core targets for ZGSII, DMA, and BA against leukopenia, and (E) the related genes correspond to GO terms. (F-H) RTsingle bondqPCR validation of selected predicted genes (IFN-γ, IL-2, CEBP-β). (I) Western blot analysis and quantification of IFN-γ expression in NB4 cells treated with ZGSⅡ, BA, DMA, or C3G for 5 days. Data represent the mean ± SD of three independent experiments. * p < 0.05, * * p < 0.01, * ** p < 0.001 versus as indicated (one-way analysis of variance). (J) Top 20 enriched KEGG pathways of core targets for ZGSII, BA, and DMA against leukopenia. |
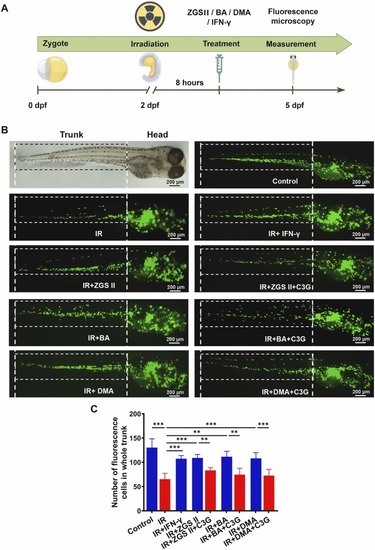
Effects of ZGS II, BA, DMA, and IFN-γ on monocytopoiesis in irradiated zebrafish. (A) mpeg1: eGFP monocytes/macrophages in Tg (mpeg1: eGFP) transgenic zebrafish treated with ZGSⅡ (10 μM), BA (10 μM), DMA (10 μM), IFN-γ (10 ng/mL), or C3G (40 μM). (B) Number of mpeg1: eGFP cells in each group. * *p < 0.01, * **p < 0.001 versus the corresponding control groups (one-way analysis of variance). IR, Irradiation. |
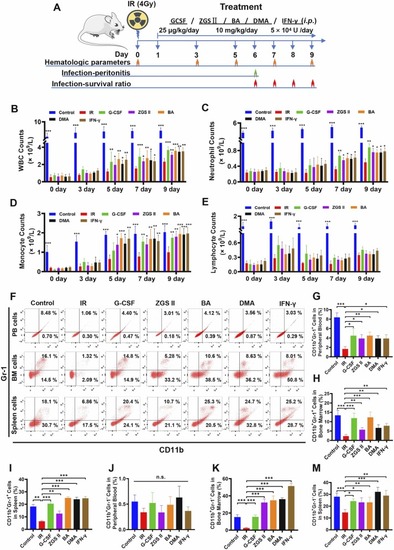
The therapeutic effect of ZGS II, DMA, BA, and IFN-γ on mice with leukopenia induced by 4 Gy X-rays. (A) Schematic diagram of the irradiation-induced leukopenia mouse model with regimen treatment. After 24 h of 4 Gy X-ray TBI, the mice were treated with regimens for 9 days with 12 mice in each group (35 μg/kg G-CSF, 10 mg/kg ZGSⅡ, 10 mg/kg BA, 10 mg/kg DMA, IFN-γ 5 ×10⁴ U/mouse). On day 6, mice were infected with P. aeruginosa (6 × 10⁶ CFU) via intraperitoneal injection for 16 h before euthanasia or via intravenous injection for survival analysis on days 6 − 9. (B) Peripheral WBC counts, (C) peripheral neutrophil counts, (D) peripheral monocyte counts, and (E) peripheral lymphocyte counts in the control group, model group, G-CSF-positive group (35 μg/kg), ZGSⅡ (10 mg/kg) group, BA (10 mg/kg) group, DMA (10 mg/kg) group and IFN-γ (5 ×10⁴ U/mouse) group. Data represent the mean ± SD of three independent experiments. * p < 0.05, * * p < 0.01, * ** p < 0.001 versus the model group (one-way analysis of variance). (F) Flow cytometry analysis of CD11b and Gr-1 expression in peripheral blood, BM cells, and spleen cells for each group after treatment for 7 days. (G-I) The histogram represents the percentage of CD11b+Gr-1+ cells (G-I) and CD11b+Gr-1− cells (J-M) in each group. Data represent the mean ± SD of three independent experiments. * p < 0.05, * * p < 0.01, * ** p < 0.001 versus the model group (one-way analysis of variance). BM: Bone marrow; TBI: total body irradiation. |
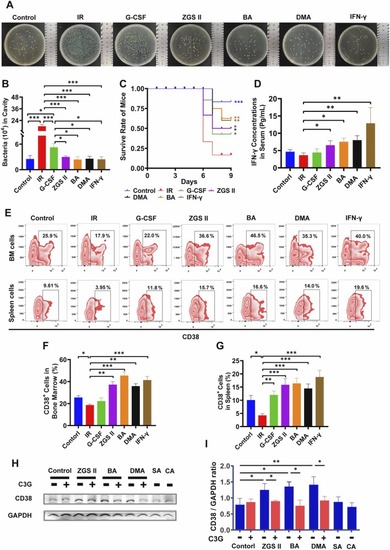
ZGS II, DMA, BA, and IFN-γ enhanced bactericidal activity by inducing IFN-γ production in an irradiated mouse model. (A−B) Bacterial killing assay in the mouse cavity. The total colony number of extracellular viable bacteria in the cavity was counted at 16 h post-infection. (C) Leukopenia mice were intravenously injected with P. aeruginosa (6 × 10⁶ CFU per mouse) in the control group, model group, G-CSF-positive group (35 μg/kg), ZGSⅡ (10 mg/kg) group, BA (10 mg/kg) group, DMA (10 mg/kg) group, and IFN-γ (5 ×10⁴ U/mouse) group. Survival was observed for 4 days post-infection. Mortality differences compared with the infected model mice were statistically significant (* p < 0.05, ** p < 0.01, *** p < 0.001), as determined by a log-rank test. (D) Levels of IFN-γ serum were determined by immunoassay for each group on day 7. Data represent the mean ± SD of four mice in each group. * p < 0.05, * * p < 0.01, * ** p < 0.001 versus the model group (one-way analysis of variance). (E) Flow cytometry analysis of CD38 expression in BM cells and spleen cells for each group after treatment for 7 days. (F, G) The histogram represents the percentage of CD11b+ cells in BM (F) and spleen (G) for each group. (H, I) Western blot analysis (H) and quantification (I) of CD38 expression of NB4 cells treated with ZGSⅡ (10 μM), DMA (10 μM), BA (10 μM), SA (10 μM), CA (10 μM) or C3G (40 μM) for 5 days. Data represent the mean ± SD of three independent experiments. * p < 0.05, * * p < 0.01, * ** p < 0.001 versus the corresponding control groups (one-way analysis of variance); n.s.= no significance. BM: Bone marrow; IR, Irradiation. |
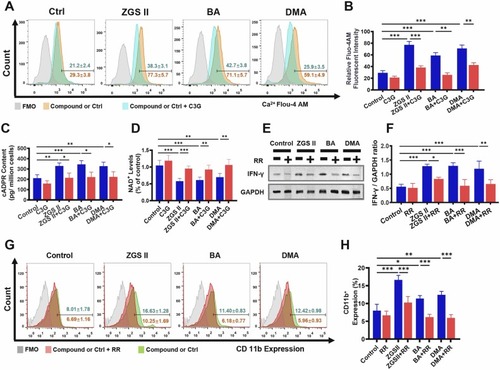
ZGS II, BA, and DMA induce myeloid differentiation by activating Ca2+ signaling. (A) Flow cytometry analysis of intracellular Ca2+ expression in NB4 cells treated with ZGSⅡ (10 μM), BA (10 μM), DMA (10 μM), or C3G (40 μM) for 5 days. (B) The histogram shows the mean fluorescent intensity (MFI) of intracellular Ca2+ as indicated by Fluo-4 AM staining in NB4 cells. (C) The expression of cADPR in NB4 cells with different treatments for 5 days. (D) The expression of NAD+ in NB4 cells with different treatments for 5 days. (E, F) Western blot analysis (E) and quantification (F) of IFN-γ expression in NB4 cells treated with ZGSⅡ (10 μM), BA (10 μM), DMA (10 μM), or RR (1.2 μM) for 5 days. (G) Flow cytometry analysis of CD11b expression in NB4 cells treated with ZGSⅡ, BA, DMA, or RR for 5 days. (H) The histogram shows the percentage of CD11b+ cells for each group. Data represent the mean ± SD of three independent experiments. * * P < 0.01 and * **P < 0.001 versus the corresponding control groups (one-way analysis of variance). RR: Ruthenium red. |
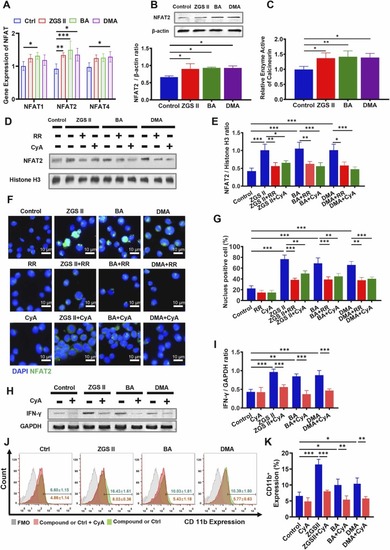
The calcineurin-NFAT pathway is present and functional in myeloid development induced by ZGS II, BA, and DMA. (A) RTsingle bondqPCR validation of Nfat1–4 mRNA expression in NB4 cells treated with 10 μM ZGSⅡ), BA, and DMA for 4 days. (B) Western blotting of NFAT2 expression of NB4 cells treated with ZGSⅡ, BA, and DMA for 5 days. (C) The activity of calcineurin in NB4 cells with different treatments for 5 days. (D, E) Western blotting (D) and quantification (E) of NFAT2 expression in the nucleus of NB4 cells treated with ZGSⅡ (10 μM), BA (10 μM), DMA (10 μM), RR (1.2 μM), or CyA (1 nM) for 5 days. (F) Immunofluorescence assay of NFAT2 expression in NB4 cells treated with ZGSⅡ, BA, DMA, RR, or CyA for 5 days. Scale bar= 10 µm. (G) The histogram shows the percentage of NFAT2 cells for each group. (H, I) Western blot analysis (H) and quantification (I) of IFN-γ expression of NB4 cells treated with ZGSⅡ, BA, DMA, or CyA for 5 days. (J) Flow cytometry analysis of CD11b expression of NB4 cells with ZGSⅡ, BA, DMA, or CyA for 5 days. (H) The histogram shows the percentage of CD11b+ cells for each group. Data represent the mean ± SD of three independent experiments. * * P < 0.01 and * **P < 0.001 versus the corresponding control groups (one-way analysis of variance). RR: Ruthenium red; CyA: Cyclosporine A. |
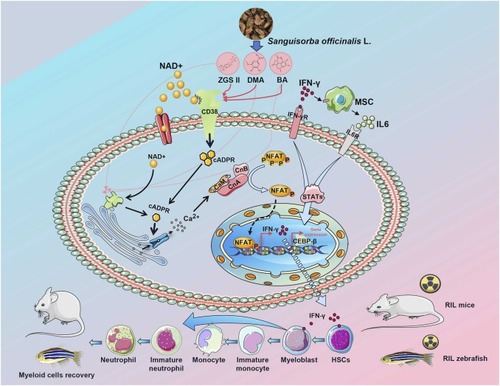
Illustration of the molecular mechanisms of ZGSⅡ, BA, and DMA in promoting myeloid differentiation and myelopoiesis. CaM, Calmodulin; CnA, Calcineurin A; CnB, Calcineurin B; NFAT, Nuclear factor of activated T cells; MSC, Mesenchymal stem cells; HSCs, Hematopoietic stem cells; RIL, Radiation-induced leukopenia. |
|