
Fig. 8
- ID
- ZDB-FIG-240411-26
- Publication
- Liu et al., 2024 - Targeting CD38/cyclic ADP-ribosyl cyclase as a novel therapeutic strategy for identification of three potent agonists for leukopenia treatment
- Other Figures
- All Figure Page
- Back to All Figure Page
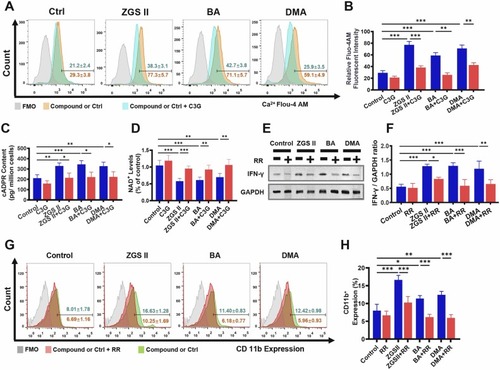
ZGS II, BA, and DMA induce myeloid differentiation by activating Ca2+ signaling. (A) Flow cytometry analysis of intracellular Ca2+ expression in NB4 cells treated with ZGSⅡ (10 μM), BA (10 μM), DMA (10 μM), or C3G (40 μM) for 5 days. (B) The histogram shows the mean fluorescent intensity (MFI) of intracellular Ca2+ as indicated by Fluo-4 AM staining in NB4 cells. (C) The expression of cADPR in NB4 cells with different treatments for 5 days. (D) The expression of NAD+ in NB4 cells with different treatments for 5 days. (E, F) Western blot analysis (E) and quantification (F) of IFN-γ expression in NB4 cells treated with ZGSⅡ (10 μM), BA (10 μM), DMA (10 μM), or RR (1.2 μM) for 5 days. (G) Flow cytometry analysis of CD11b expression in NB4 cells treated with ZGSⅡ, BA, DMA, or RR for 5 days. (H) The histogram shows the percentage of CD11b+ cells for each group. Data represent the mean ± SD of three independent experiments. * * P < 0.01 and * **P < 0.001 versus the corresponding control groups (one-way analysis of variance). RR: Ruthenium red. |