
|
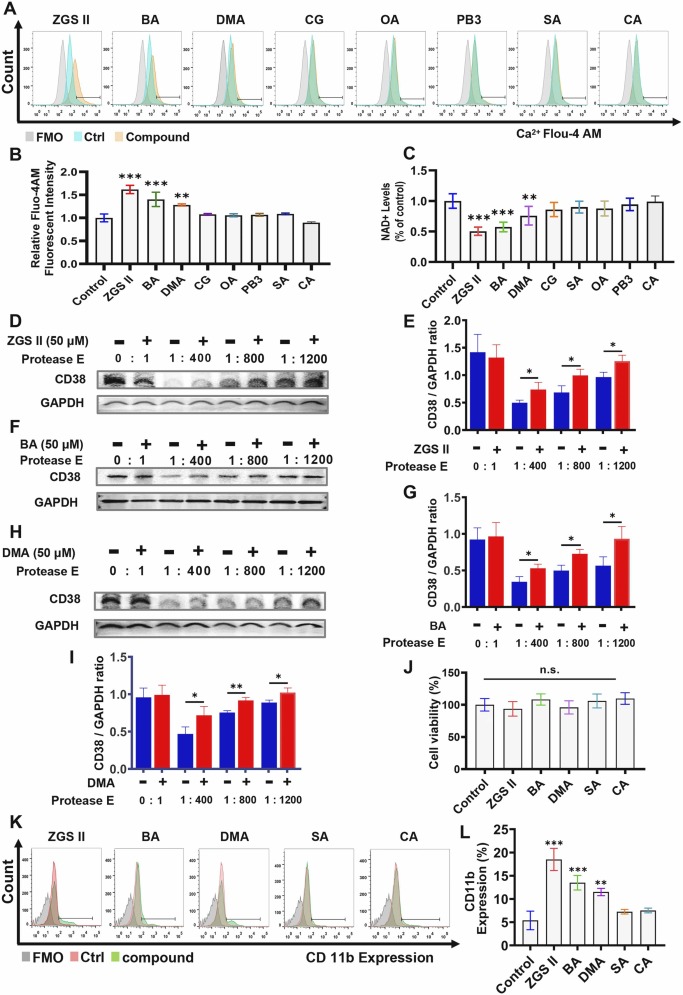
Fig. 2 Identification of compounds that positively target the ADP ribosyl cyclase of CD38. (A) Flow cytometry analysis of intracellular Ca2+ expression in NB4 cells treated with 10 μM of each compound, including ZGSⅡ, CG, OA, PB3, BA, DMA, SA, and CA for 5 days. DMSO was used as a vehicle control. Negative control: the SA-treated group and the CA-treated group. (B) Quantification (mean fluorescent intensity, MFI) of intracellular Ca2+ as indicated by Fluo-4 AM staining in NB4 cells. (C) The expression of NAD+ in NB4 cells with different treatments for 5 days. Data represent the mean ± SD of three independent experiments. * * P < 0.01, and * **P < 0.001, versus the control groups; (one-way analysis of variance) (D-I) The DARTS assay indicates the binding between positive compounds (10 μM ZGSⅡ, DMA, and BA) and CD38 protein. Data represent the mean ± SD of three independent experiments. * * P < 0.01, and * **P < 0.001, versus the corresponding control groups; (student’s unpaired two-tailed t-test) (J) Proliferation assay. CCK-8 assay for NB4 cell proliferation after treatment with 10 μM ZGSⅡ, BA, and DMA for 4 days. (K, L) Flow cytometry analysis (K) and quantification (L) of CD11b expression after NB4 cells were treated with 10 μM ZGSⅡ, DMA, BA, SA, and CA for 5 days. Data represent the mean ± SD of three independent experiments. * * P < 0.01, and * **P < 0.001, versus the control group (one-way analysis of variance); n.s.= no significance.