
|
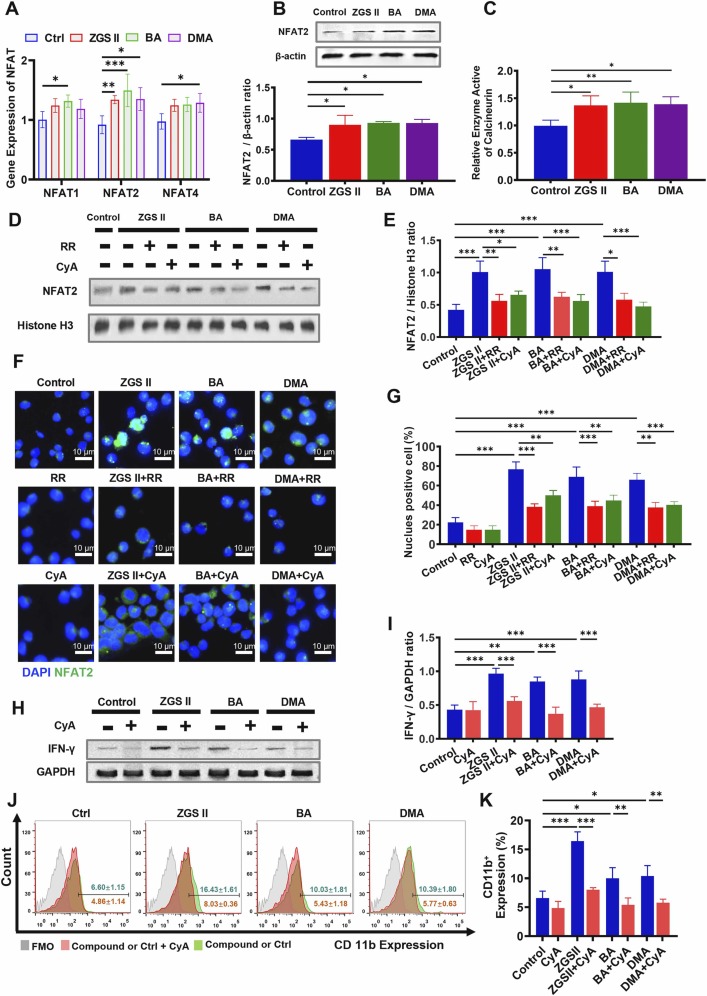
Fig. 9 The calcineurin-NFAT pathway is present and functional in myeloid development induced by ZGS II, BA, and DMA. (A) RTsingle bondqPCR validation of Nfat1–4 mRNA expression in NB4 cells treated with 10 μM ZGSⅡ), BA, and DMA for 4 days. (B) Western blotting of NFAT2 expression of NB4 cells treated with ZGSⅡ, BA, and DMA for 5 days. (C) The activity of calcineurin in NB4 cells with different treatments for 5 days. (D, E) Western blotting (D) and quantification (E) of NFAT2 expression in the nucleus of NB4 cells treated with ZGSⅡ (10 μM), BA (10 μM), DMA (10 μM), RR (1.2 μM), or CyA (1 nM) for 5 days. (F) Immunofluorescence assay of NFAT2 expression in NB4 cells treated with ZGSⅡ, BA, DMA, RR, or CyA for 5 days. Scale bar= 10 µm. (G) The histogram shows the percentage of NFAT2 cells for each group. (H, I) Western blot analysis (H) and quantification (I) of IFN-γ expression of NB4 cells treated with ZGSⅡ, BA, DMA, or CyA for 5 days. (J) Flow cytometry analysis of CD11b expression of NB4 cells with ZGSⅡ, BA, DMA, or CyA for 5 days. (H) The histogram shows the percentage of CD11b+ cells for each group. Data represent the mean ± SD of three independent experiments. * * P < 0.01 and * **P < 0.001 versus the corresponding control groups (one-way analysis of variance). RR: Ruthenium red; CyA: Cyclosporine A.