
|
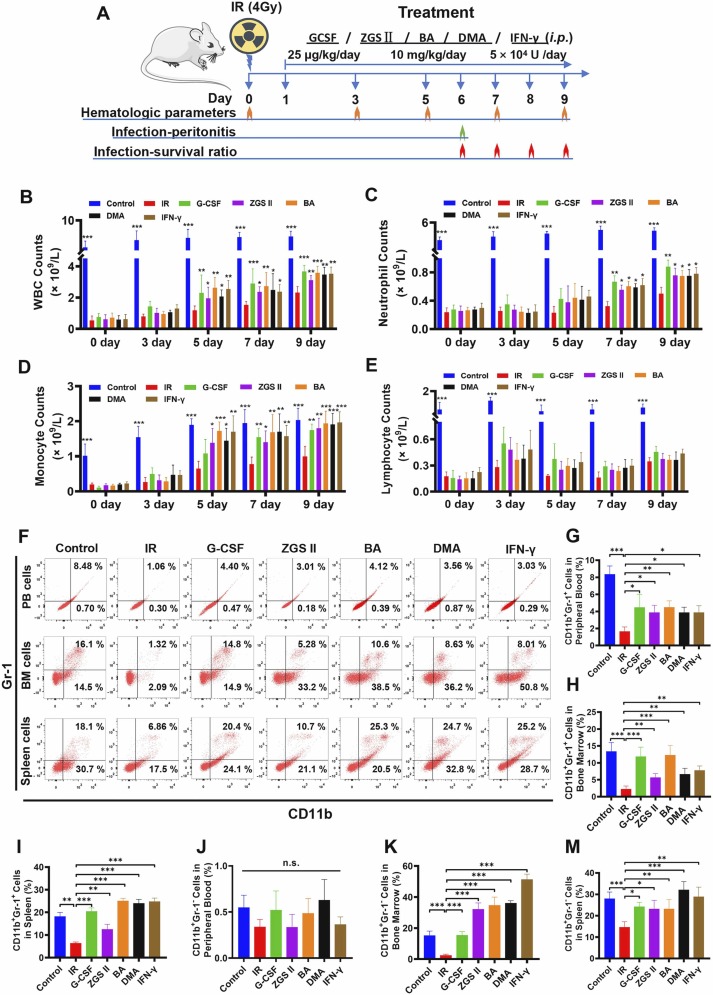
Fig. 6 The therapeutic effect of ZGS II, DMA, BA, and IFN-γ on mice with leukopenia induced by 4 Gy X-rays. (A) Schematic diagram of the irradiation-induced leukopenia mouse model with regimen treatment. After 24 h of 4 Gy X-ray TBI, the mice were treated with regimens for 9 days with 12 mice in each group (35 μg/kg G-CSF, 10 mg/kg ZGSⅡ, 10 mg/kg BA, 10 mg/kg DMA, IFN-γ 5 ×10⁴ U/mouse). On day 6, mice were infected with P. aeruginosa (6 × 10⁶ CFU) via intraperitoneal injection for 16 h before euthanasia or via intravenous injection for survival analysis on days 6 − 9. (B) Peripheral WBC counts, (C) peripheral neutrophil counts, (D) peripheral monocyte counts, and (E) peripheral lymphocyte counts in the control group, model group, G-CSF-positive group (35 μg/kg), ZGSⅡ (10 mg/kg) group, BA (10 mg/kg) group, DMA (10 mg/kg) group and IFN-γ (5 ×10⁴ U/mouse) group. Data represent the mean ± SD of three independent experiments. * p < 0.05, * * p < 0.01, * ** p < 0.001 versus the model group (one-way analysis of variance). (F) Flow cytometry analysis of CD11b and Gr-1 expression in peripheral blood, BM cells, and spleen cells for each group after treatment for 7 days. (G-I) The histogram represents the percentage of CD11b+Gr-1+ cells (G-I) and CD11b+Gr-1− cells (J-M) in each group. Data represent the mean ± SD of three independent experiments. * p < 0.05, * * p < 0.01, * ** p < 0.001 versus the model group (one-way analysis of variance). BM: Bone marrow; TBI: total body irradiation.