
Image
|
Figure Caption
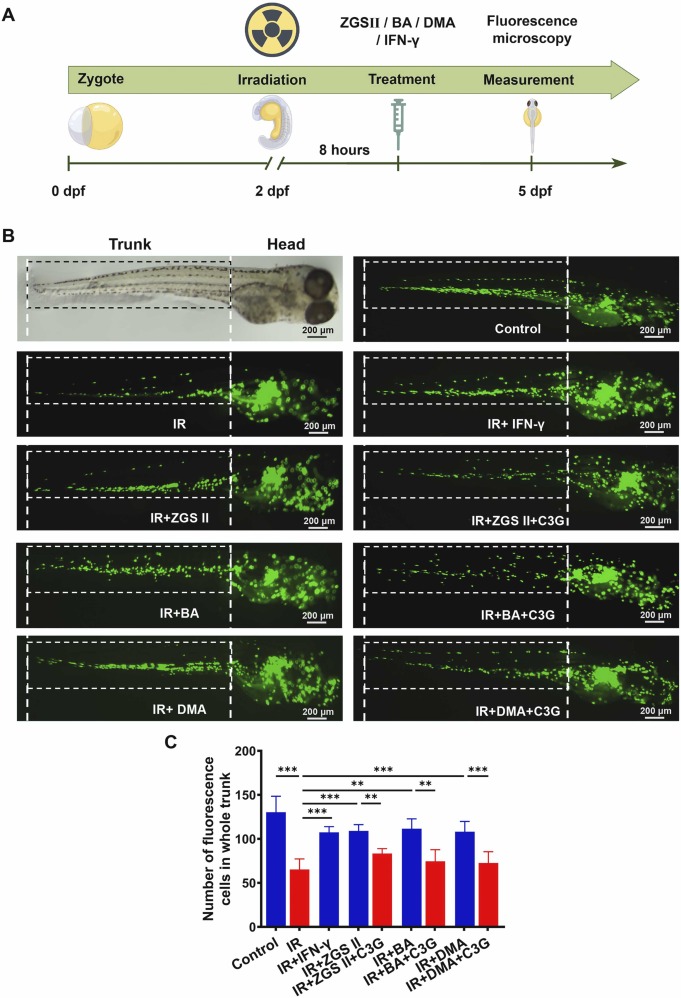
Fig. 5 Effects of ZGS II, BA, DMA, and IFN-γ on monocytopoiesis in irradiated zebrafish. (A) mpeg1: eGFP monocytes/macrophages in Tg (mpeg1: eGFP) transgenic zebrafish treated with ZGSⅡ (10 μM), BA (10 μM), DMA (10 μM), IFN-γ (10 ng/mL), or C3G (40 μM). (B) Number of mpeg1: eGFP cells in each group. * *p < 0.01, * **p < 0.001 versus the corresponding control groups (one-way analysis of variance). IR, Irradiation.
Acknowledgments
This image is the copyrighted work of the attributed author or publisher, and
ZFIN has permission only to display this image to its users.
Additional permissions should be obtained from the applicable author or publisher of the image.
Full text @ Pharmacol. Res.