
- Title
-
Molecular organization of neuronal cell types and neuromodulatory systems in the zebrafish telencephalon
- Authors
- Anneser, L., Satou, C., Hotz, H.R., Friedrich, R.W.
- Source
- Full text @ Curr. Biol.
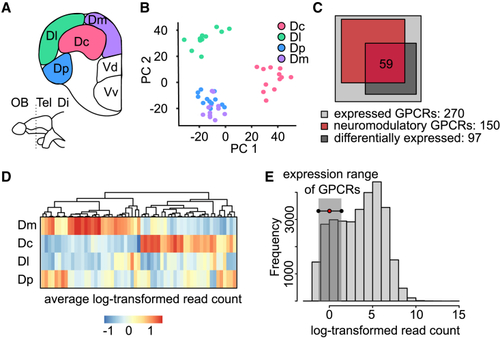
Transcriptomic profile of pallial regions based on bulk sequencing (A) Coronal section through the adult zebrafish telencephalon showing the four pallial regions (Dc, Dm, Dl, and Dp) dissected for bulk sequencing. Tel, telencephalon; Di, diencephalon; OB, olfactory bulb. (B) Expression patterns of the 2,000 most variable genes projected onto the first two PCs. Each data point is one replicate from a pallial region (color-coded). Dp and Dm can be separated in projections onto PCs 3 and 4 ( (C) Venn diagram showing the number of GPCRs that was differentially expressed across brain areas and associated with neuromodulatory systems. Expression analysis was performed using the intersection between these sets (n = 59 genes). (D) Expression of the 59 GPCRs across pallial brain regions, sorted by clustering. (E) Histogram showing expression levels of different genes, quantified by averaged read count, and expression range of GPCRs. Related to |
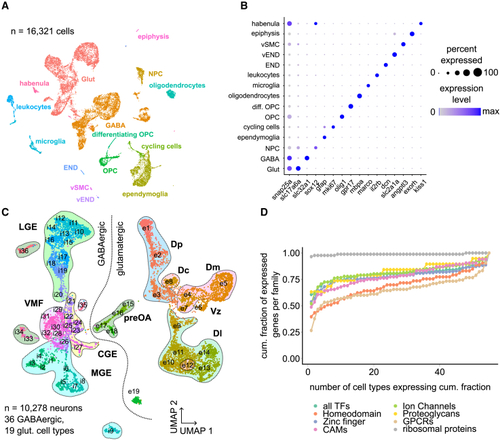
scRNA-seq of the adult zebrafish telencephalon reveals neuronal diversity (A) Uniform manifold approximation and projection (UMAP) representation of the 16,321 sequenced cells, color-coded by cell-type clustering. END, endothelial cells; vEND, vascular endothelial cells; vSMC, vascular smooth muscle cell; OPC, oligodendrocyte precursor cell; NPC; neural progenitor cell. (B) Expression of selected marker genes in individual cell types. Color indicates expression level (normalized log read count), and dot size represents fraction of expressing cells per cluster. (C) UMAP plot of 10,278 neuronal cells clustered separately. Cluster identity is indicated by IDs for excitatory (e1–e19) and inhibitory (i1–i36) cell types. Association of cell types with brain area is shown by shaded areas. LGE, lateral ganglionic eminence; VMF, ventromedial forebrain; CGE, caudal ganglionic eminence; MGE, medial ganglionic eminence; preOA, preoptic area; Dp, posterior zone of the dorsal pallium; Dc, central zone of the dorsal pallium; Dm, medial zone of the dorsal pallium; Dl, lateral zone of the dorsal pallium. (D) Cumulative fraction of cell types expressing different gene families (TFs, transcription factors; homeodomain TFs; zinc-finger TFs, CAMs, cell adhesion molecules; ion channels; proteoglycans; ribosomal proteins; GPCRs). Related to |
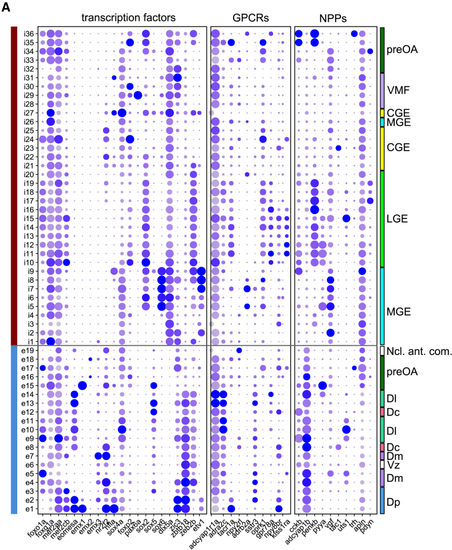
Expression pattern of marker genes (A) Expression pattern of selected transcription factors, GPCRs, and neuropeptide precursor (NPP) genes. Color indicates expression level (normalized log read count), and dot size represents fraction of expressing cells per cluster as in |
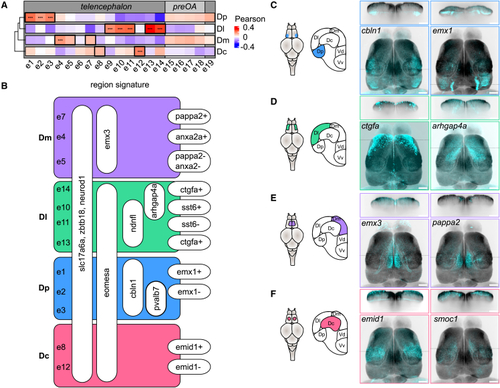
Glutamatergic cell types: molecular signatures and anatomical localization (A) Correlation between the gene expression profile of individual cell types and the bulk transcriptome of pallial regions. The analysis included 734 genes that were differentially expressed between brain regions in the bulk sequencing dataset and among the 2,000 most variable genes of the scRNA-seq dataset. (B) Hierarchical molecular signature distinguishing glutamatergic cell types in the dorsal pallium. (C–F) Maximum intensity projection of gene expression patterns along the dorsoventral axis obtained from hybridization chain reaction (HCR) against two exemplary marker genes per brain region (cyan; z-projection of confocal images) overlaid on the Related to |
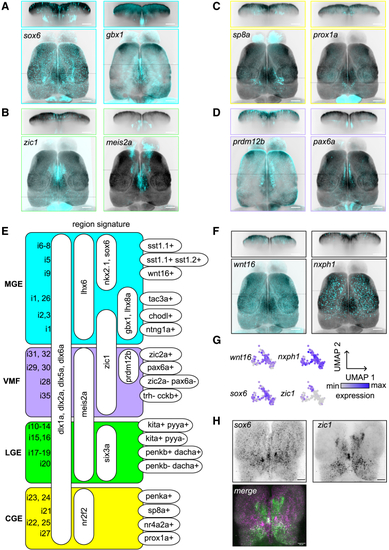
GABAergic cell types in the pallium and subpallium (A) HCR visualization of (B) Cells derived from the lateral ganglionic eminence (LGE) are marked by the presence of (C) Marker genes of the caudal ganglionic eminence (CGE), (D) Expression of (E) Hierarchical molecular signature of putative GABAergic cell types. (F) Expression of markers for MGE-derived pallial interneuron type i9 ( (G) Enlargement of i9 in UMAP space and color-coded expression levels of the four marker genes. (H) Co-labeling of Related to |

Evolutionary conservation of cell types between fish and reptiles (A) Scores of cell-type alignments between the zebrafish telencephalon and the bearded dragon whole-brain atlas, subsampled for telencephalic, mesencephalic, and diencephalic neuronal cell types, segregated by their neurotransmitter (ACh was not detected in the mesencephalon). The analysis was restricted to zebrafish cell types with a minimum alignment score of 0.1 (dotted line). ACh, acetylcholine. (B) Alignment scores of individual cell types. Blocks separate glutamatergic and GABAergic cells in the zebrafish (vertical) and brain regions in the lizard (horizontal). Color-coded cell types are used as examples for alignment analysis in (C)–(F). (C) Expression of markers for cell types in the zebrafish telencephalon that were associated with MC and DMC in the lizard (dorsal view, maximum intensity projections; same in all panels). Expression patterns stratify Dl along the anterior/lateral-to-posterior/medial axis. The marker gene (D) Binarized gene expression patterns of conserved GPCR and transcription factors in Dl of zebrafish and MC/DMC of the lizard. (E) Overlapping expression of (F) Binary expression patterns showing a common transcription factor code for MGE-derived neurons in zebrafish and the lizard, but distinct GPCR fingerprints of Related to |
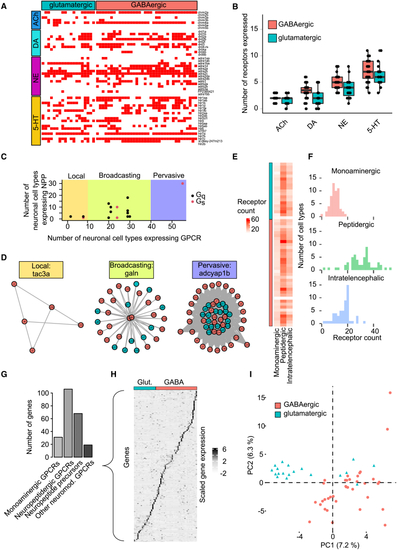
Neuromodulatory networks within the zebrafish telencephalon (A) Binarized expression of monoaminergic GPCRs (y axis) in different cell types (x axis). Expression was counted if reads were detected in at least 5% of cells per cell type. (B) Number of GPCRs for different monoaminergic neuromodulators expressed by glutamatergic and GABAergic cells. Boxplots show median, first, and third quartile. Whiskers extend to the largest value no further than 1.5 ∗ the inter-quartile range. Dots show individual data points. (C) Relationship between number of cell types expressing NPPs and their receptors. Each data point represents one NPP-receptor pair. Shadings indicate regions corresponding to different types of networks (local, broadcasting, and pervasive). Most networks are of the broadcasting type. G protein type indicated by color. (D) Graphs show individual examples of each type of signaling network. (E) Number of GPCRs for three signaling systems in all telencephalic cell types. (F) Distributions of receptor counts shown in (E). (G) Number of expressed genes associated with neuromodulation, separated into four different categories. (H) Normalized ( (I) Normalized expression matrix in (H) projected onto the first two PCs. GABAergic and glutamatergic cell types are separated but no obvious additional clusters are observed. Related to |