
|
Figure 2
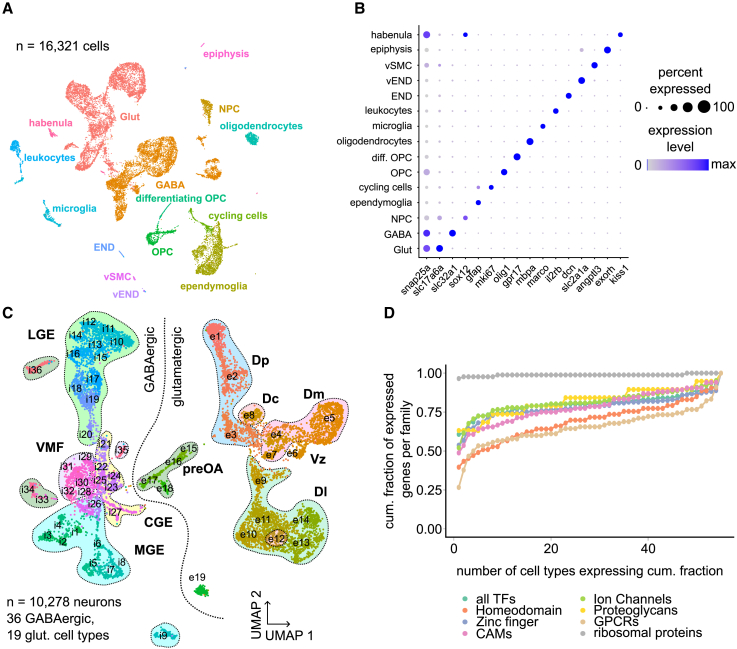
scRNA-seq of the adult zebrafish telencephalon reveals neuronal diversity
(A) Uniform manifold approximation and projection (UMAP) representation of the 16,321 sequenced cells, color-coded by cell-type clustering. END, endothelial cells; vEND, vascular endothelial cells; vSMC, vascular smooth muscle cell; OPC, oligodendrocyte precursor cell; NPC; neural progenitor cell.
(B) Expression of selected marker genes in individual cell types. Color indicates expression level (normalized log read count), and dot size represents fraction of expressing cells per cluster.
(C) UMAP plot of 10,278 neuronal cells clustered separately. Cluster identity is indicated by IDs for excitatory (e1–e19) and inhibitory (i1–i36) cell types. Association of cell types with brain area is shown by shaded areas. LGE, lateral ganglionic eminence; VMF, ventromedial forebrain; CGE, caudal ganglionic eminence; MGE, medial ganglionic eminence; preOA, preoptic area; Dp, posterior zone of the dorsal pallium; Dc, central zone of the dorsal pallium; Dm, medial zone of the dorsal pallium; Dl, lateral zone of the dorsal pallium.
(D) Cumulative fraction of cell types expressing different gene families (TFs, transcription factors; homeodomain TFs; zinc-finger TFs, CAMs, cell adhesion molecules; ion channels; proteoglycans; ribosomal proteins; GPCRs).
Related to