IMAGE

Figure 3

ID
ZDB-IMAGE-240127-1
Source
Figures for Anneser et al., 2023
Image
Figure Caption

Figure 3

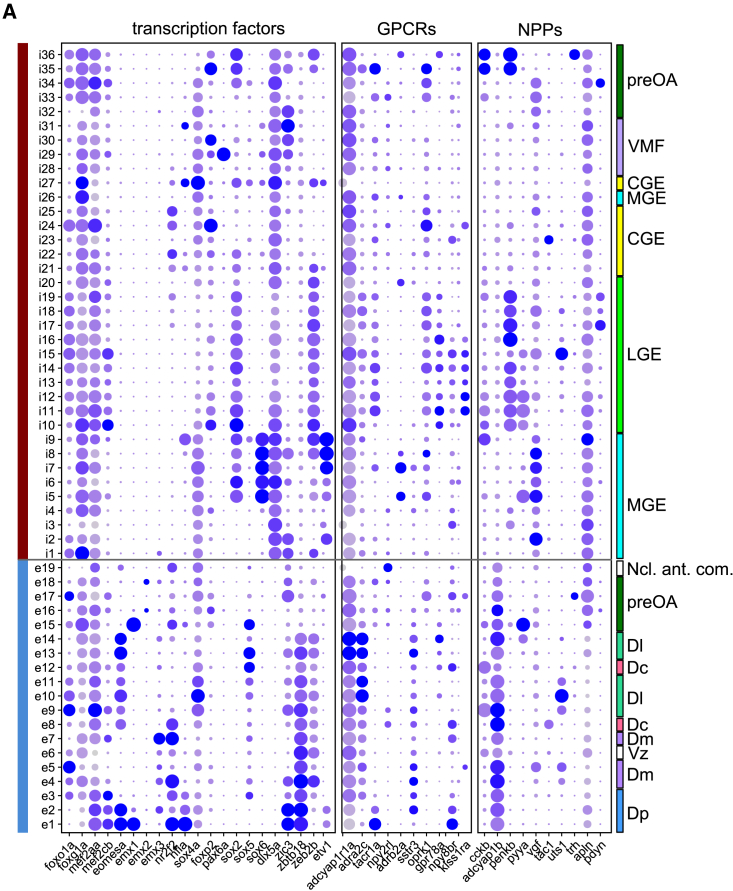
Expression pattern of marker genes

(A) Expression pattern of selected transcription factors, GPCRs, and neuropeptide precursor (NPP) genes. Color indicates expression level (normalized log read count), and dot size represents fraction of expressing cells per cluster as in Figure 2B. GPCRs, G protein-coupled receptors; NPPs, neuropeptide precursor; LGE, lateral ganglionic eminence; VMF, ventromedial forebrain; CGE, caudal ganglionic eminence; MGE, medial ganglionic eminence; preOA, preoptic area; Dp, posterior zone of the dorsal pallium; Dc, central zone of the dorsal pallium; Dm, medial zone of the dorsal pallium; Dl, lateral zone of the dorsal pallium, Ncl. ant. com, nucleus of the anterior commissure; Vz, ventricular zone.

Acknowledgments
This image is the copyrighted work of the attributed author or publisher, and ZFIN has permission only to display this image to its users. Additional permissions should be obtained from the applicable author or publisher of the image. Full text @ Curr. Biol.