FIGURE

Figure 5

ID
ZDB-FIG-240127-5
Publication
Anneser et al., 2023 - Molecular organization of neuronal cell types and neuromodulatory systems in the zebrafish telencephalon
Other Figures
All Figure Page
Back to All Figure Page
Figure 5

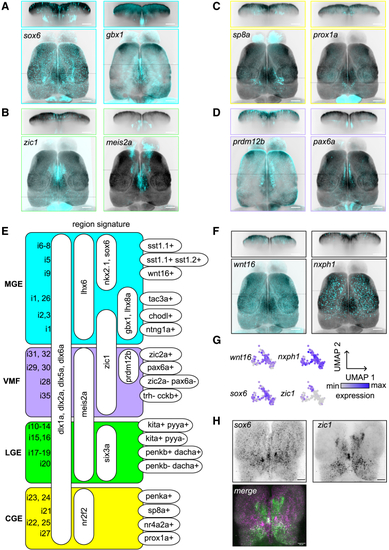
GABAergic cell types in the pallium and subpallium

(A) HCR visualization of sox6 and gbx1, two marker genes for discrete medial ganglionic eminence (MGE)-derived GABAergic cell types (dorsal view, maximum intensity projections in all panels, position of cross-section is indicated by dotted line).

(B) Cells derived from the lateral ganglionic eminence (LGE) are marked by the presence of meis2a and the absence of zic1, forming a cellular stream from subpallium to the olfactory bulb.

(C) Marker genes of the caudal ganglionic eminence (CGE), sp8a and prox1a, were expressed in a sparse band in the posterior subpallium. Outside the telencephalon, strong expression of prox1a is seen in the habenula.

(D) Expression of prdm12b and pax6a in the ventromedial forebrain lateral to the MGE-derived gbx1+ population.

(E) Hierarchical molecular signature of putative GABAergic cell types.

(F) Expression of markers for MGE-derived pallial interneuron type i9 (wnt16, nxph1, sox6, zic1; see also A and B) is sparse and differs along the anterior-posterior axis.

(G) Enlargement of i9 in UMAP space and color-coded expression levels of the four marker genes.

(H) Co-labeling of sox6 and zic1 in the same brain showing expression in different neurons. Scale bars: approximately 200 μm in (A)–(D) and (F) and 50 μm in (G).

Related to Figure S7 and Data S1.

Expression Data

Expression Detail
Antibody Labeling
Phenotype Data

Phenotype Detail
Acknowledgments
This image is the copyrighted work of the attributed author or publisher, and ZFIN has permission only to display this image to its users. Additional permissions should be obtained from the applicable author or publisher of the image. Full text @ Curr. Biol.