
Figure 4
- ID
- ZDB-FIG-240127-4
- Publication
- Anneser et al., 2023 - Molecular organization of neuronal cell types and neuromodulatory systems in the zebrafish telencephalon
- Other Figures
- All Figure Page
- Back to All Figure Page
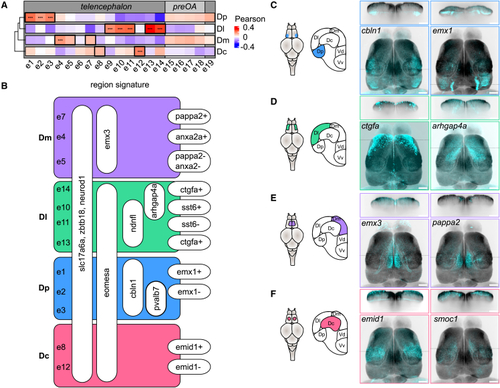
Glutamatergic cell types: molecular signatures and anatomical localization (A) Correlation between the gene expression profile of individual cell types and the bulk transcriptome of pallial regions. The analysis included 734 genes that were differentially expressed between brain regions in the bulk sequencing dataset and among the 2,000 most variable genes of the scRNA-seq dataset. (B) Hierarchical molecular signature distinguishing glutamatergic cell types in the dorsal pallium. (C–F) Maximum intensity projection of gene expression patterns along the dorsoventral axis obtained from hybridization chain reaction (HCR) against two exemplary marker genes per brain region (cyan; z-projection of confocal images) overlaid on the Related to |