
|
Figure 6
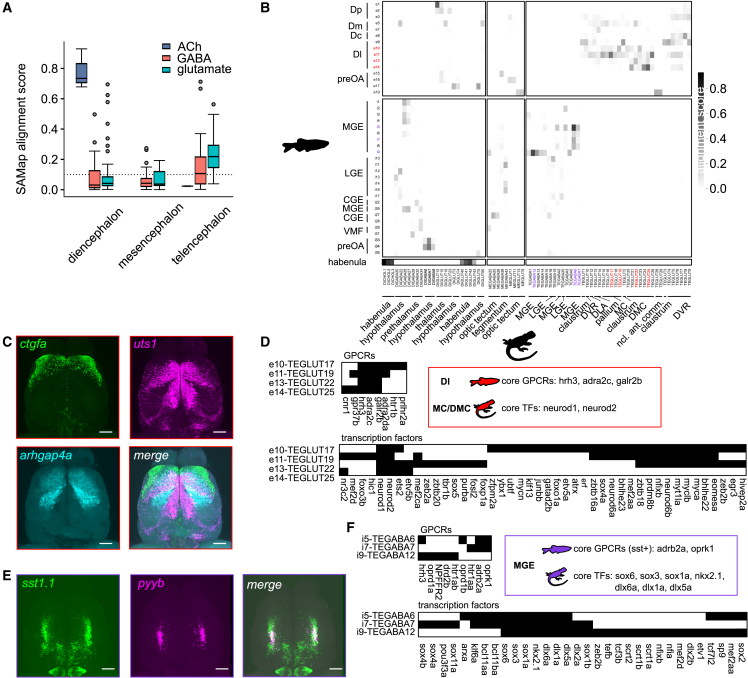
Evolutionary conservation of cell types between fish and reptiles
(A) Scores of cell-type alignments between the zebrafish telencephalon and the bearded dragon whole-brain atlas, subsampled for telencephalic, mesencephalic, and diencephalic neuronal cell types, segregated by their neurotransmitter (ACh was not detected in the mesencephalon). The analysis was restricted to zebrafish cell types with a minimum alignment score of 0.1 (dotted line). ACh, acetylcholine.
(B) Alignment scores of individual cell types. Blocks separate glutamatergic and GABAergic cells in the zebrafish (vertical) and brain regions in the lizard (horizontal). Color-coded cell types are used as examples for alignment analysis in (C)–(F).
(C) Expression of markers for cell types in the zebrafish telencephalon that were associated with MC and DMC in the lizard (dorsal view, maximum intensity projections; same in all panels). Expression patterns stratify Dl along the anterior/lateral-to-posterior/medial axis. The marker gene
(D) Binarized gene expression patterns of conserved GPCR and transcription factors in Dl of zebrafish and MC/DMC of the lizard.
(E) Overlapping expression of
(F) Binary expression patterns showing a common transcription factor code for MGE-derived neurons in zebrafish and the lizard, but distinct GPCR fingerprints of
Related to