
Figure 7
- ID
- ZDB-FIG-240127-7
- Publication
- Anneser et al., 2023 - Molecular organization of neuronal cell types and neuromodulatory systems in the zebrafish telencephalon
- Other Figures
- All Figure Page
- Back to All Figure Page
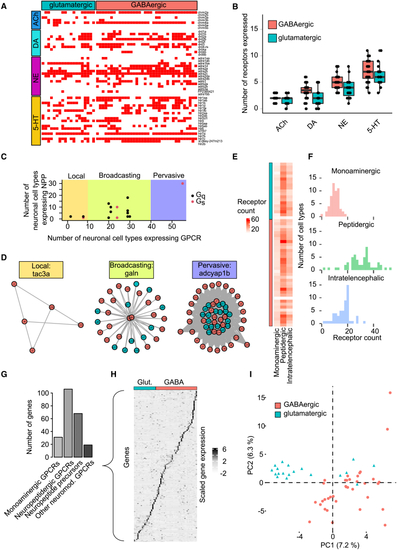
Neuromodulatory networks within the zebrafish telencephalon (A) Binarized expression of monoaminergic GPCRs (y axis) in different cell types (x axis). Expression was counted if reads were detected in at least 5% of cells per cell type. (B) Number of GPCRs for different monoaminergic neuromodulators expressed by glutamatergic and GABAergic cells. Boxplots show median, first, and third quartile. Whiskers extend to the largest value no further than 1.5 ∗ the inter-quartile range. Dots show individual data points. (C) Relationship between number of cell types expressing NPPs and their receptors. Each data point represents one NPP-receptor pair. Shadings indicate regions corresponding to different types of networks (local, broadcasting, and pervasive). Most networks are of the broadcasting type. G protein type indicated by color. (D) Graphs show individual examples of each type of signaling network. (E) Number of GPCRs for three signaling systems in all telencephalic cell types. (F) Distributions of receptor counts shown in (E). (G) Number of expressed genes associated with neuromodulation, separated into four different categories. (H) Normalized ( (I) Normalized expression matrix in (H) projected onto the first two PCs. GABAergic and glutamatergic cell types are separated but no obvious additional clusters are observed. Related to |