
Figure 1
- ID
- ZDB-FIG-240127-1
- Publication
- Anneser et al., 2023 - Molecular organization of neuronal cell types and neuromodulatory systems in the zebrafish telencephalon
- Other Figures
- All Figure Page
- Back to All Figure Page
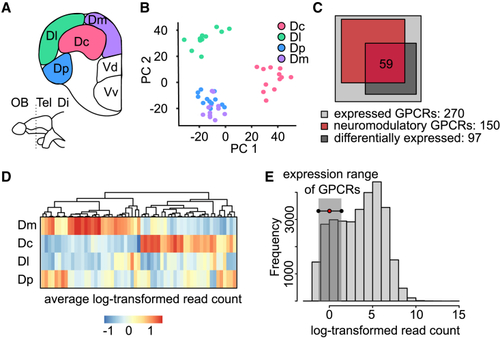
Transcriptomic profile of pallial regions based on bulk sequencing (A) Coronal section through the adult zebrafish telencephalon showing the four pallial regions (Dc, Dm, Dl, and Dp) dissected for bulk sequencing. Tel, telencephalon; Di, diencephalon; OB, olfactory bulb. (B) Expression patterns of the 2,000 most variable genes projected onto the first two PCs. Each data point is one replicate from a pallial region (color-coded). Dp and Dm can be separated in projections onto PCs 3 and 4 ( (C) Venn diagram showing the number of GPCRs that was differentially expressed across brain areas and associated with neuromodulatory systems. Expression analysis was performed using the intersection between these sets (n = 59 genes). (D) Expression of the 59 GPCRs across pallial brain regions, sorted by clustering. (E) Histogram showing expression levels of different genes, quantified by averaged read count, and expression range of GPCRs. Related to |