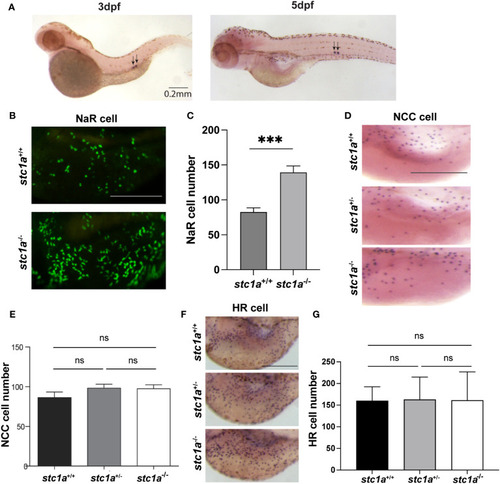
CS-derived Stc1a regulates the proliferation of NaR cells, but not other ionocyte types. (A)In situ hybridization analysis of stc1a mRNA expression in 3 and 5 days post fertilization (pdf) larvae. Arrows indicate the corpuscles of Stannius. (B, C) Loss of Stc1a increases NaR cell proliferation. stc1a+/+;Tg(igfbp5a:GFP), stc1a-/-;Tg(igfbp5a:GFP) embryos were raised in E3 embryo medium to 5 day post fertilization (dpf) and analyzed. Representative views are shown in (B). Scale bar = 0.2 mm. The NaR cell numbers were quantified and shown in (C). n = 16-19 larvae/group ***, P < 0.001. (D, E) NCC cells. Larvae (4 dpf) of the indicated genotypes were analyzed by in situ hybridization for slc12a10.2 mRNA expression. Representative views are shown in (D) and quantified data in (E). Scale bar = 0.2 mm. n = 4~13. ns, not statistically significant. (F, G) HR cells. Larvae (4 dpf) of the indicated genotypes were analyzed by in situ hybridization for atpv61al mRNA expression. Representative views are shown in (F) and quantified data in (G). Scale bar = 0.2 mm. n = 10~15 larvae/group. ns, not statistically significant. Images shown here and in all following figures are lateral views of the yolk sac region. Anterior to the left and dorsal up. Data shown are Mean ± SEM.

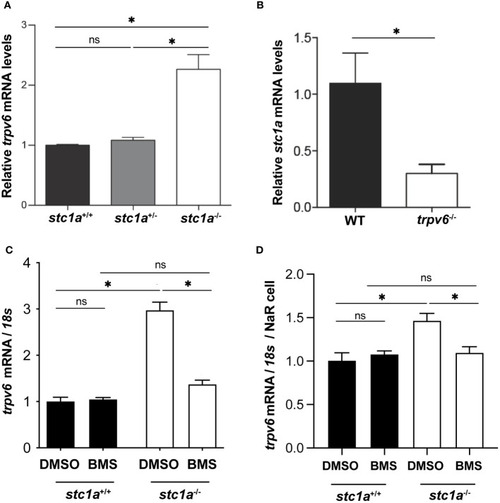
Stc1a and Trpv6 regulate each other’s expression. (A) Loss of Stc1a increases trpv6 mRNA levels. Fish of the indicated genotypes were raised in E3 embryo medium. At 5 dpf, the trpv6 mRNA levels were measured and normalized by 18S RNA levels. n = 15~17. *, P < 0.05. (B) Loss of Trpv6 reduces stc1a mRNA levels. Embryos of the indicated genotypes were raised in E3 embryo medium. At 5 dpf, the stc1a mRNA levels were measured and normalized by 18S RNA levels. n = 15~17. *, P < 0.05. (C, D) IGF signaling is critical in increasing Trpv6 expression in stc1a-/- fish. Larvae (4 pdf) of the indicated genotypes were treated with DMSO or BMS-754807 for one day and the trpv6 mRNA levels were measured and normalized by 18S rRNA (C). The data were further normalized by NaR cell numbers and shown in (D). Data shown are from 3 independent experiments, each containing 15 larvae/group. *, P < 0.05. ns, not statistically significant.

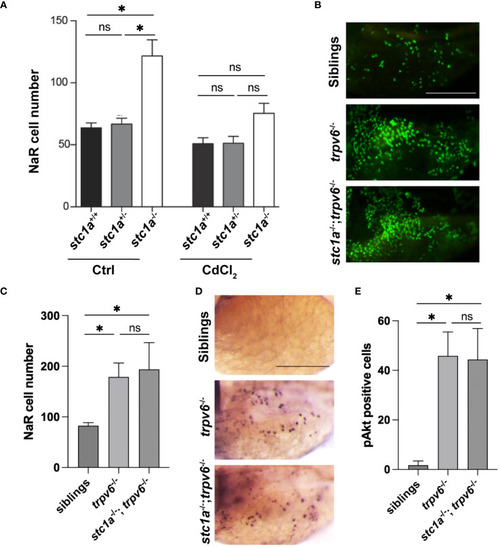
Stc1a and Trpv6 suppress NaR cell proliferation via the same IGF signaling pathway. (A) Inhibition of Trpv6 abolishes the elevated NaR cell proliferation in stc1a-/- larvae. Larvae (3 dpf) of the indicated genotypes were treated with DMSO or 10 μg/L CdCl2 for 2 days. GFP-labeled NaR cells were quantified and shown. n = 4~19 fish/group. *, P < 0.05. ns, not statistically significant. (B, C)stc1a-/-; trpv6-/- double mutants phenocopy trpv6-/- fish. Progeny of stc1a+/-; trpv6+/- in the Tg(igfbp5a:GFP) background were raised in E3 medium. At 5dpf, NaR cells were quantified and shown. These larvae were genotyped individually Representative images are shown in (B) and quantified data in (C). n = 4~19 larvae/group. Scale bar = 0.2 mm. (D, E) Progenies of stc1a+/-; trpv6+/- intercrosses were raised in E3 medium. They were subjected to whole mount immunohistochemistry using an anti-phospho-Akt antibody. Phospho-Akt positive cells in the yolk sac region were quantified. The larvae were genotyped individually afterwards. Representative images are shown in (D) and quantified data in (E). n = 5~14 larvae/group. Scale bar = 0.2 mm.

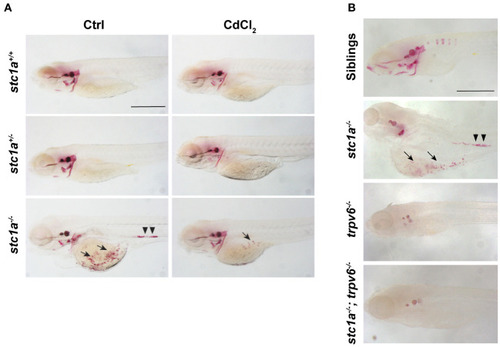
Loss of Stc1a results in abnormal calcium deposits in a Trpv6-depndent manner. (A) Larvae (3 dpf) of the indicated genotypes treated with or without 10 μg/L CdCl2 for 2 days. They were subjected to Alizarin red staining at 5 dpf. Representative images are shown. Note the ectopic calcified structures in the yolk sac region (arrow) and kidney stones (arrow heads) in the mutant fish. Scale bar = 0.5 mm. (B) Alizarin red staining analysis of 7 dpf zebrafish larvae of the indicated genotypes. Representative images are shown. Note the ectopic calcified structures in the yolk sac region (arrow) and kidney stones (arrow heads) in the mutant fish. Scale bar = 0.2 mm.

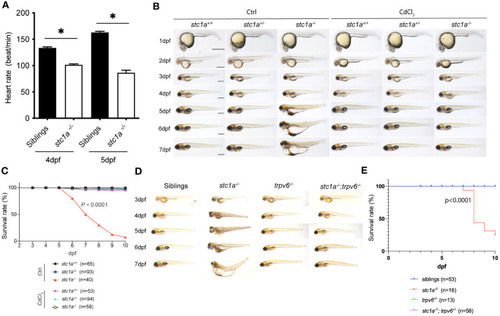
Pharmacological inhibition and double deletion of Trpv6 rescues cardiac edema and body swelling, and delays premature death of stc1a-/- fish. (A) Loss of Stc1a reduces heartbeat rate. Heartbeat rate stc1a-/- and siblings was determined and shown. *, P < 0.05. n = 9~17. (B) Gross morphology of fish of the indicated genotypes at the indicated time. Progeny of stc1a+/- intercrosses were raised in E3 embryo medium and treated with or without 10 μg/L CdCl2 from 3 dpf until the indicated time. Fish were genotyped individually. Representative views of the indicated genotypes at the indicated stages are shown and survival curve shown in (C). Scale bar = 0.5 mm. P < 0.0001 by log-rank test. (D, E) Gross morphology of fish of the indicated genotypes at the indicated time. Representative views at the indicated stages are shown and survival curve shown in (E). Scale bar = 0.2 mm. P < 0.0001 by log-rank test.

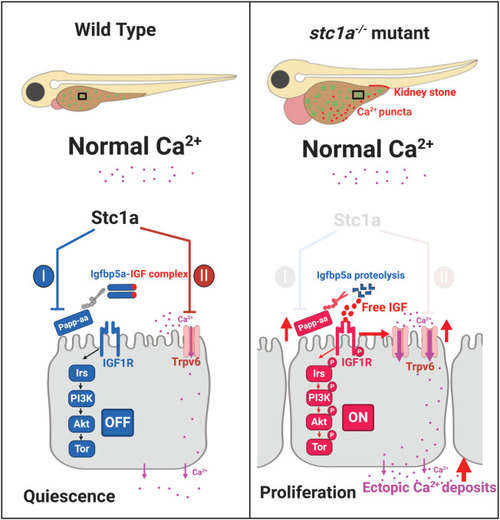
A proposed model. Stc1a plays dual roles in ionocytes. Stc1a suppresses local IGF signaling and inhibits NaR cell proliferation by inhibiting Papp-aa-mediated Igfbp5a degradation. Stc1a also inhibits Trpv6 expression and activities. These two functions are linked. Trpv6-mediated calcium signaling inhibits IGF signaling, while IGF signaling upregulates Trpv6 expression. A loss of Stc1a reactivates IGF-PI3 kinase-Akt-Tor signaling in NaR cells and increased NaR cell proliferation. In addition, Trpv6 expression and Trpv6-mediated calcium uptake in each NaR cell are elevated in the stc1a-/- mutant fish. These changes contribute to abnormal calcium deposits in the yolk sac region and kidney and to the developemnt of cardiac edema, body swelling, and premature death phenotypes.

Acknowledgments
This image is the copyrighted work of the attributed author or publisher, and ZFIN has permission only to display this image to its users. Additional permissions should be obtained from the applicable author or publisher of the image. Full text @ Front Endocrinol (Lausanne)