IMAGE

Figure 3

ID
ZDB-IMAGE-231115-17
Source
Figures for Li et al., 2023
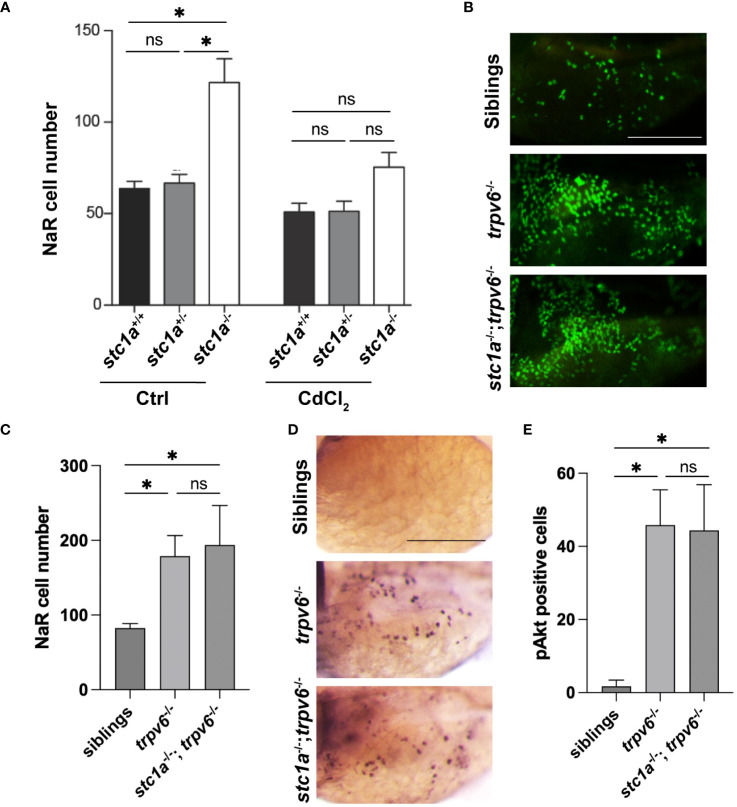
Image
Figure Caption

Figure 3

Stc1a and Trpv6 suppress NaR cell proliferation via the same IGF signaling pathway. (A) Inhibition of Trpv6 abolishes the elevated NaR cell proliferation in stc1a-/- larvae. Larvae (3 dpf) of the indicated genotypes were treated with DMSO or 10 μg/L CdCl2 for 2 days. GFP-labeled NaR cells were quantified and shown. n = 4~19 fish/group. *, P < 0.05. ns, not statistically significant. (B, C)stc1a-/-; trpv6-/- double mutants phenocopy trpv6-/- fish. Progeny of stc1a+/-; trpv6+/- in the Tg(igfbp5a:GFP) background were raised in E3 medium. At 5dpf, NaR cells were quantified and shown. These larvae were genotyped individually Representative images are shown in (B) and quantified data in (C). n = 4~19 larvae/group. Scale bar = 0.2 mm. (D, E) Progenies of stc1a+/-; trpv6+/- intercrosses were raised in E3 medium. They were subjected to whole mount immunohistochemistry using an anti-phospho-Akt antibody. Phospho-Akt positive cells in the yolk sac region were quantified. The larvae were genotyped individually afterwards. Representative images are shown in (D) and quantified data in (E). n = 5~14 larvae/group. Scale bar = 0.2 mm.

Acknowledgments
This image is the copyrighted work of the attributed author or publisher, and ZFIN has permission only to display this image to its users. Additional permissions should be obtained from the applicable author or publisher of the image. Full text @ Front Endocrinol (Lausanne)