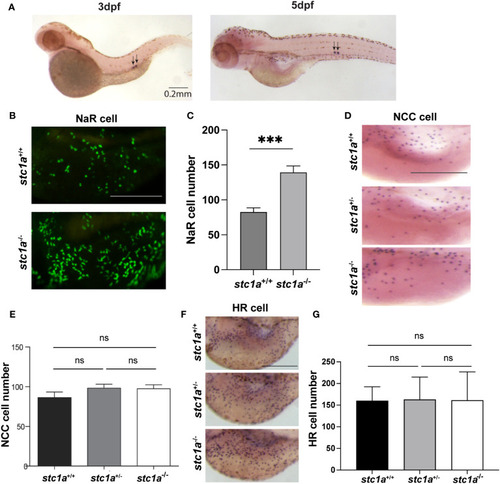
CS-derived Stc1a regulates the proliferation of NaR cells, but not other ionocyte types. (A)In situ hybridization analysis of stc1a mRNA expression in 3 and 5 days post fertilization (pdf) larvae. Arrows indicate the corpuscles of Stannius. (B, C) Loss of Stc1a increases NaR cell proliferation. stc1a+/+;Tg(igfbp5a:GFP), stc1a-/-;Tg(igfbp5a:GFP) embryos were raised in E3 embryo medium to 5 day post fertilization (dpf) and analyzed. Representative views are shown in (B). Scale bar = 0.2 mm. The NaR cell numbers were quantified and shown in (C). n = 16-19 larvae/group ***, P < 0.001. (D, E) NCC cells. Larvae (4 dpf) of the indicated genotypes were analyzed by in situ hybridization for slc12a10.2 mRNA expression. Representative views are shown in (D) and quantified data in (E). Scale bar = 0.2 mm. n = 4~13. ns, not statistically significant. (F, G) HR cells. Larvae (4 dpf) of the indicated genotypes were analyzed by in situ hybridization for atpv61al mRNA expression. Representative views are shown in (F) and quantified data in (G). Scale bar = 0.2 mm. n = 10~15 larvae/group. ns, not statistically significant. Images shown here and in all following figures are lateral views of the yolk sac region. Anterior to the left and dorsal up. Data shown are Mean ± SEM.
|
