FIGURE SUMMARY
Title

Telomerase RNA-based aptamers restore defective myelopoiesis in congenital neutropenic syndromes

Authors
Martínez-Balsalobre, E., García-Castillo, J., García-Moreno, D., Naranjo-Sánchez, E., Fernández-Lajarín, M., Blasco, M.A., Alcaraz-Pérez, F., Mulero, V., Cayuela, M.L.
Source
Full text @ Nat. Commun.

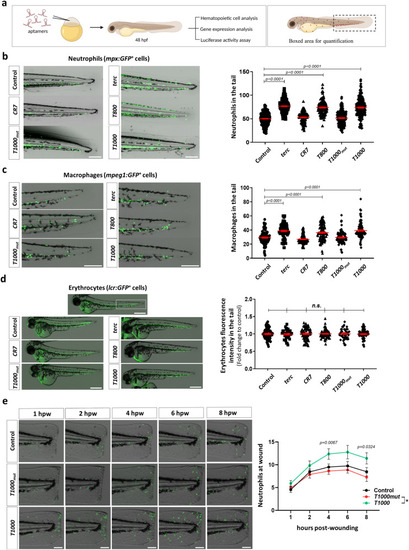
T800 and T1000 aptamers enforce myelopoiesis in zebrafish.

a General workflow (created with Bio Render). Representative pictures of mpx:GFP (b) and mpeg1:GFP (c) larvae tail and lcr:GFP (d) complete larvae by 48 h post-fertilization (hpf) microinjected with the indicated aptamers. Right panels show quantification of neutrophils (b), macrophages (c) and erythrocyte fluorescence intensity in the white boxed area (d). e Representative images of mpx:GFP larvae transected tails from 1 to 8 h post-wounding (hpw) and quantification of neutrophil migration to the wound as neutrophil number mean±s.e.m. for all larvae. b Data are average of 5 independent experiments. Each dot represents a single larva (Control, n = 315; terc, n = 223; CR7, n = 120; T800, n = 151; T1000mut, n = 224; T1000, n = 219). Mean ± SEM for each group is also shown. Statistical analysis according to ordinary 1way ANOVA followed by Dunnett’s multiple comparison test (95% confidence interval). Scale bar: 250 um. c Data are average of 3 independent experiments. Each dot represents a single larva (Control, n = 97; terc, n = 84; CR7, n = 88; T800, n = 93; T1000mut, n = 92; T1000, n = 102). Mean ± SEM for each group is also shown. Statistical analysis according to ordinary 1way ANOVA followed by Dunnett’s multiple comparison test (95% confidence interval). Scale bar: 250 um. d Data are average of 3 independent experiments. Each dot represents a single larva (Control, n = 72; terc, n = 34; CR7, n = 75; T800, n = 71; T1000mut, n = 46; T1000, n = 75). Mean ± SEM for each group is also shown. n.s., not significant, p > 0.05 according to ordinary 1way ANOVA followed by Dunnett’s multiple comparison test (95% confidence interval). Scale bar: 500 um. e Data are shown as mean ± SEM of 3 independent experiments (Control, n = 30; T1000mut, n = 38; T1000, n = 43). Differences are statistically significant between T1000mut and T1000 groups. Statistical analysis according to mixed-effects analysis followed by Tukey’s multiple comparison test (95% confidence interval). Scale bar: 100 um. Image was created with BioRender.com by co-Authors. Source data are provided as a Source Data file.

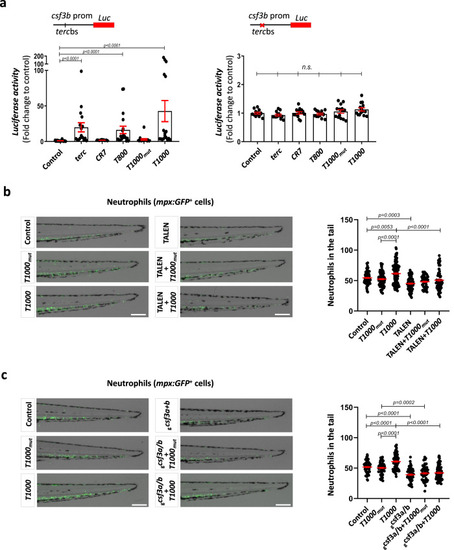
T1000 aptamer enforce myelopoiesis by activating gcsf3b tercbs and gcsfa/b expression.

a Luciferase assay using wild type or mutant tercbs of csf3b promoter. Luciferase activity was normalized to Renilla activity and the results shown as fold change relative to control. b, c Representative images and neutrophil quantification of 72 hpf Tg(mpx:GFP) tail larvae. Larvae were microinjected with the indicated aptamer in combination with TALEN targeting the gcsf3b tercbs promoter (b) or gRNAs against csf3a/b genes (c). Data are average of 3 independent experiments. a Each dot represents a biologically independent sample consisting of a pool of 20 larvae (Left: Control, n = 19; terc, n = 16; CR7, n = 10; T800, n = 19; T1000mut, n = 15; T1000, n = 18. Right: Control, n = 13; terc, n = 14; CR7, n = 14; T800, n = 14; T1000mut, n = 14; T1000, n = 14). Bars represent mean ± SEM for each group. n.s., not significant, p > 0.05 according to Kruskal-Wallis followed by Dunn’s multiple comparison test (95% confidence interval). b Each dot represents a single larva (Control, n = 76; T1000mut, n = 84; T1000, n = 109; TALEN, n = 75; TALEN+T1000mut, n = 51; TALEN+T1000, n = 77). Mean ± SEM for each group is also shown. Statistical analysis according to ordinary 1way ANOVA followed by Sidak’s multiple comparison test (95% confidence interval). Scale bar: 200 um. c Each dot represents a single larva (Control, n = 59; T1000mut, n = 66; T1000, n = 81; gcsf3a+b, n = 56; gcsf3a+b +T1000mut, n = 59; gcsf3a+b +T1000, n = 71). Mean ± SEM for each group is also shown. Statistical analysis according to ordinary 1way ANOVA followed by Sidak’s multiple comparison test (95% confidence interval). Scale bar: 200 um. Source data are provided as a Source Data file.

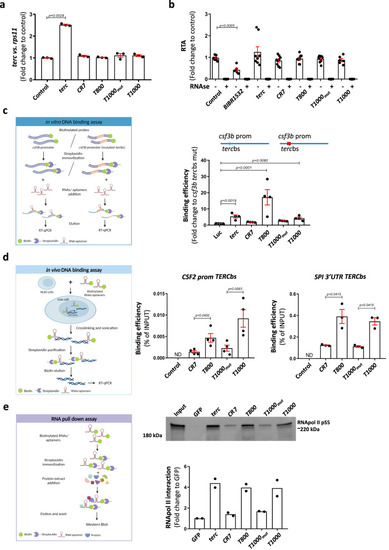
Aptamers physically bind to DNA and to RNApolII.

aterc RNA levels determined by RT-qPCR in 48hpf larvae microinjected with full terc or the indicated aptamers. Gene expression was normalized to rps11 and then to the control sample. b Relative telomerase activity (RTA) measured by qPCR in protein extracts of 48 hpf larvae in the indicated conditions. c RT-qPCR of in vitro DNA-binding assay eluates showing the affinity for the wildtype csf3b promoter related to the csf3b promoter with mutated terc binding site (tercbs), and compared to Luc control. d RT-qPCR of in vivo DNA-binding assay eluates showing the affinity for the CSF2 promoter TERCbs or the SPI 3’UTR TERCbs. e Western blot and quantification of aptamer RNA pulldown eluates using anti-phospho-serine 5 RNA Pol II antibody. a Data are average of 3 biologically independent samples. Each dot represents a pool of 20 larvae. Bars represent mean ± SEM. Statistical analysis according to Kruskal-Wallis followed by uncorrected Dunn’s test (95% confidence interval). b Data are average of 3 independent experiments. Each dot represents a biologically independent sample consisting of a pool of 25 larvae (Control, n = 6; BIBR1532, n = 6; terc, n = 8; CR7, n = 6; T800, n = 9; T1000mut, n = 9; T1000, n = 9). Bars represent mean ± SEM. Statistical analysis according to Kruskal-Wallis followed by uncorrected Dunn’s test (95% confidence interval). c Data are average of 4 independent experiments. Bars represent mean ± SEM. Statistical analysis according to Kruskal-Wallis followed by Dunn’s multiple comparison test (95% confidence interval). d Data are average of 3-4 independent experiments. Bars represent mean ± SEM. Statistical analysis according to Kruskal-Wallis followed by uncorrected Dunn’s test (95% confidence interval). e Data are average of 2 independent experiments. Each dot represents a biologically independent sample consisting of a pool of 25 larvae. Bars represent mean. Images were created with BioRender.com by co-authors. Source data are provided as a Source Data file.

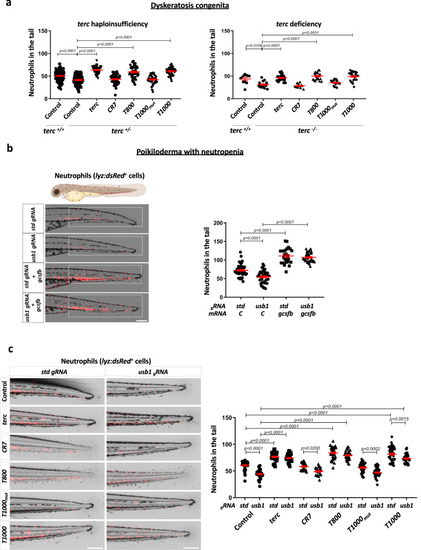
Aptamers rescue neutropenia in zebrafish models of DC and PN.

a Neutrophils quantification at 48 hpf in terc +/- (obtained from mpx:GFP fish outcrossed with terc -/-) and terc -/- (obtained from a terc -/- incross) larvae microinyected with the indicated RNAs. terc -/- larvae were stained with TSA reagent to visualize neutophils. b Representative pictures and neutrophils (dsRed positive cells) quantification at 72 hpf in the tail of lyz:dsRED larvae microinjected with usb1 or std gRNA plus recombinant Cas9 in presence or absence of gcsfb mRNA. The white boxes show the quantified area. c Representative images and neutrophils quantification at 72 hpf in lyz:dsRED larval tail microinjected with usb1 or std gRNA plus recombinant Cas9 and the indicated aptamers. a Each dot represents a single larva (Left: +/+ Control, n = 126; +/- Control, n = 96; +/- terc, n = 48; +/- CR7, n = 52; +/- T800, n = 57; +/- T1000mut, n = 52; +/- T1000, n = 54. Right: +/+ Control, n = 11; -/- Control, n = 16; -/- terc, n = 26; -/- CR7, n = 11; -/- T800, n = 20; -/- T1000mut, n = 24; -/- T1000, n = 25). Mean ± SEM for each group is also shown. Left: Statistical analysis according to ordinary 1way ANOVA followed by Dunnett’s multiple comparison test (95% confidence interval). Right: Statistical analysis according to Kruskal-Wallis followed by Dunn’s multiple comparison test (95% confidence interval). b Data are average of 3 independent experiments. Each dot represents a single larva (Control+gstd, n = 41; Control+gusb1, n = 40; gcsfb+gstd, n = 25; gcsfb+gusb1, n = 37). Mean ± SEM for each group is also shown. Statistical analysis according to ordinary 1way ANOVA followed by Dunnett’s multiple comparison test (95% confidence interval). Scale bar: 250 um. c Data are average of 3 independent experiments. Each dot represents a single larva (Control+gstd, n = 42; Control+gusb1, n = 36; terc+gstd, n = 46; terc+gusb1, n = 39; CR7+gstd, n = 21; CR7+gusb1, n = 22; T800+gstd, n = 39; T800+gusb1, n = 32; T1000mut+gstd, n = 38; T1000mut+gusb1, n = 38; T1000+gstd, n = 42; T1000+gusb1, n = 39). Mean ± SEM for each group is also shown. Statistical analysis according to ordinary 1way ANOVA followed by Sidak’s multiple comparison test (95% confidence interval). Scale bar: 250 um. Image was created with BioRender.com by co-Authors. Source data are provided as a Source Data file.

Aptamers rescue defective myelopoiesis in mouse and iPSC from DC patients.

a Left graph; comparison of the composition of erythroid and myeloid colonies assayed by colony assays, using whole bone marrow cells from mice of the indicated phenotype. Middle and right graphs; composition of erythroids and myeloids assayed by colony assays, using whole bone marrow cells from mice of the indicated phenotype an incubated with the mouse T1000 aptamer. N = 7 for wt and Terc -/- mice and N = 5 for Tert -/- mice. b Induced-pluripotent stem cell (iPSC) workflow. c Composition of erythroids and myeloids assayed by colony assays, using embryonic bodies (EBs) derived from the indicated iPSC lines treated with different aptamers. d Quantification of the hemogenic progenitors (HEPs) population (CD31 + /CD34 + /CD45-) by flow cytometry at day 15 in EBs. e mRNA levels of SPI1 assayed by RT-qPCR in the different conditions. The expression is normalized to GAPDH and relative to control sample. a Data are average of at least 5 biologically independent samples (wt, n = 7; Tert-/-, n = 5; Terc-/-, n = 7). Bars represent mean ± SEM. Statistical analysis according to 2way ANOVA followed by Dunnett’s multiple comparison test (95% confidence interval). c Data are average of 3 biologically independent samples. Bars represent mean ± SEM. Statistical analysis according to 2way ANOVA followed by Dunnett’s multiple comparison test (95% confidence interval). d Data are average of 3 biologically independent samples represented by dots. Bars represent mean ± SEM for each group. n.s., not significant, p > 0.05 according to Kruskal-Wallis followed by Dunn’s multiple comparison test (95% confidence interval). e Data are average of 3 biologically independent samples represented by dots. Bars represent mean ± SEM. Statistical analysis according to Kruskal-Wallis followed by Dunn’s multiple comparison test (95% confidence interval). Source data are provided as a Source Data file.

Acknowledgments
This image is the copyrighted work of the attributed author or publisher, and ZFIN has permission only to display this image to its users. Additional permissions should be obtained from the applicable author or publisher of the image. Full text @ Nat. Commun.