IMAGE

Fig. 4

ID
ZDB-IMAGE-231002-217
Source
Figures for Martínez-Balsalobre et al., 2023
Image
Figure Caption

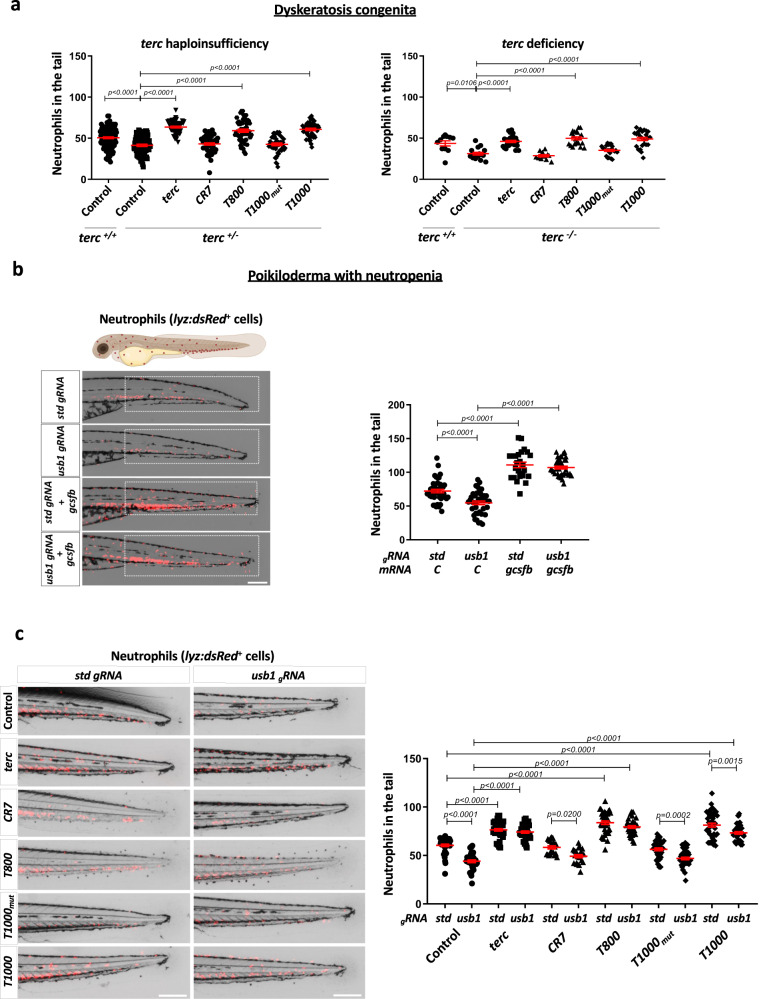
Fig. 4 Aptamers rescue neutropenia in zebrafish models of DC and PN.

a Neutrophils quantification at 48 hpf in terc +/- (obtained from mpx:GFP fish outcrossed with terc -/-) and terc -/- (obtained from a terc -/- incross) larvae microinyected with the indicated RNAs. terc -/- larvae were stained with TSA reagent to visualize neutophils. b Representative pictures and neutrophils (dsRed positive cells) quantification at 72 hpf in the tail of lyz:dsRED larvae microinjected with usb1 or std gRNA plus recombinant Cas9 in presence or absence of gcsfb mRNA. The white boxes show the quantified area. c Representative images and neutrophils quantification at 72 hpf in lyz:dsRED larval tail microinjected with usb1 or std gRNA plus recombinant Cas9 and the indicated aptamers. a Each dot represents a single larva (Left: +/+ Control, n = 126; +/- Control, n = 96; +/- terc, n = 48; +/- CR7, n = 52; +/- T800, n = 57; +/- T1000mut, n = 52; +/- T1000, n = 54. Right: +/+ Control, n = 11; -/- Control, n = 16; -/- terc, n = 26; -/- CR7, n = 11; -/- T800, n = 20; -/- T1000mut, n = 24; -/- T1000, n = 25). Mean ± SEM for each group is also shown. Left: Statistical analysis according to ordinary 1way ANOVA followed by Dunnett’s multiple comparison test (95% confidence interval). Right: Statistical analysis according to Kruskal-Wallis followed by Dunn’s multiple comparison test (95% confidence interval). b Data are average of 3 independent experiments. Each dot represents a single larva (Control+gstd, n = 41; Control+gusb1, n = 40; gcsfb+gstd, n = 25; gcsfb+gusb1, n = 37). Mean ± SEM for each group is also shown. Statistical analysis according to ordinary 1way ANOVA followed by Dunnett’s multiple comparison test (95% confidence interval). Scale bar: 250 um. c Data are average of 3 independent experiments. Each dot represents a single larva (Control+gstd, n = 42; Control+gusb1, n = 36; terc+gstd, n = 46; terc+gusb1, n = 39; CR7+gstd, n = 21; CR7+gusb1, n = 22; T800+gstd, n = 39; T800+gusb1, n = 32; T1000mut+gstd, n = 38; T1000mut+gusb1, n = 38; T1000+gstd, n = 42; T1000+gusb1, n = 39). Mean ± SEM for each group is also shown. Statistical analysis according to ordinary 1way ANOVA followed by Sidak’s multiple comparison test (95% confidence interval). Scale bar: 250 um. Image was created with BioRender.com by co-Authors. Source data are provided as a Source Data file.

Acknowledgments
This image is the copyrighted work of the attributed author or publisher, and ZFIN has permission only to display this image to its users. Additional permissions should be obtained from the applicable author or publisher of the image. Full text @ Nat. Commun.