|
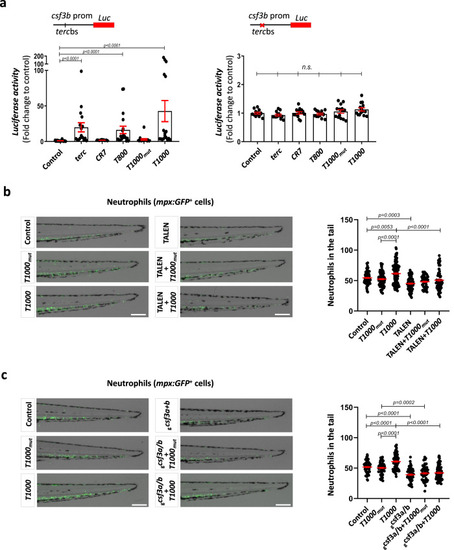
T1000 aptamer enforce myelopoiesis by activating gcsf3b tercbs and gcsfa/b expression. a Luciferase assay using wild type or mutant tercbs of csf3b promoter. Luciferase activity was normalized to Renilla activity and the results shown as fold change relative to control. b, c Representative images and neutrophil quantification of 72 hpf Tg(mpx:GFP) tail larvae. Larvae were microinjected with the indicated aptamer in combination with TALEN targeting the gcsf3b tercbs promoter (b) or gRNAs against csf3a/b genes (c). Data are average of 3 independent experiments. a Each dot represents a biologically independent sample consisting of a pool of 20 larvae (Left: Control, n = 19; terc, n = 16; CR7, n = 10; T800, n = 19; T1000mut, n = 15; T1000, n = 18. Right: Control, n = 13; terc, n = 14; CR7, n = 14; T800, n = 14; T1000mut, n = 14; T1000, n = 14). Bars represent mean ± SEM for each group. n.s., not significant, p > 0.05 according to Kruskal-Wallis followed by Dunn’s multiple comparison test (95% confidence interval). b Each dot represents a single larva (Control, n = 76; T1000mut, n = 84; T1000, n = 109; TALEN, n = 75; TALEN+T1000mut, n = 51; TALEN+T1000, n = 77). Mean ± SEM for each group is also shown. Statistical analysis according to ordinary 1way ANOVA followed by Sidak’s multiple comparison test (95% confidence interval). Scale bar: 200 um. c Each dot represents a single larva (Control, n = 59; T1000mut, n = 66; T1000, n = 81; gcsf3a+b, n = 56; gcsf3a+b +T1000mut, n = 59; gcsf3a+b +T1000, n = 71). Mean ± SEM for each group is also shown. Statistical analysis according to ordinary 1way ANOVA followed by Sidak’s multiple comparison test (95% confidence interval). Scale bar: 200 um. Source data are provided as a Source Data file.
|