IMAGE

Fig. 5

ID
ZDB-IMAGE-231002-224
Source
Figures for Martínez-Balsalobre et al., 2023
Image
Figure Caption

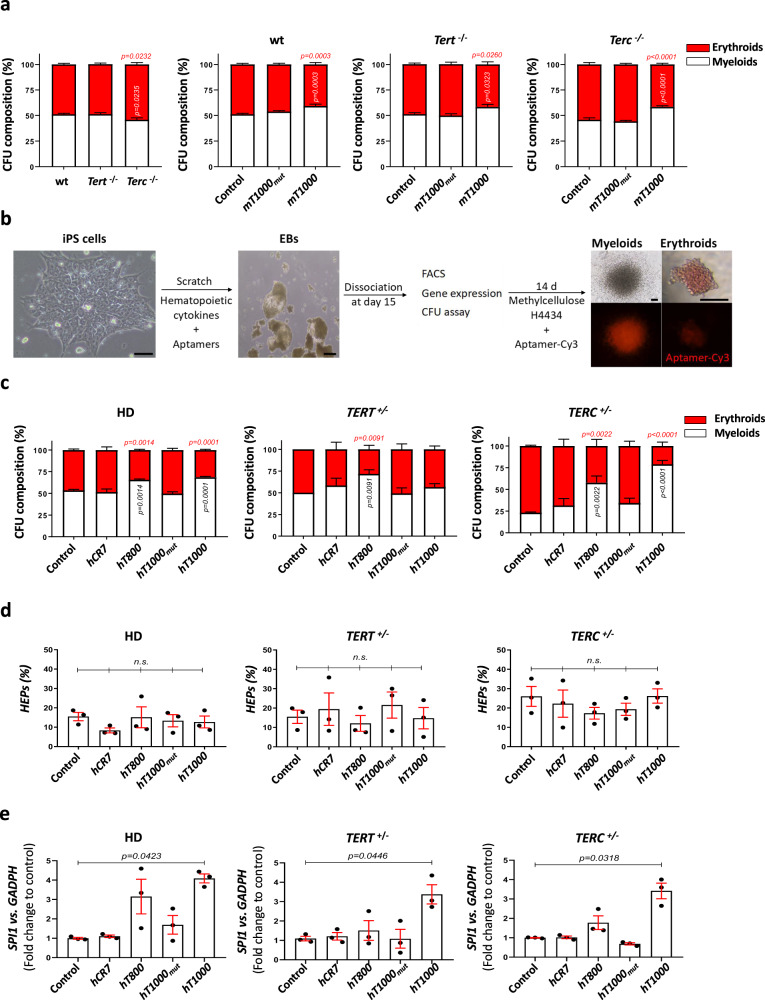
Fig. 5 Aptamers rescue defective myelopoiesis in mouse and iPSC from DC patients.

a Left graph; comparison of the composition of erythroid and myeloid colonies assayed by colony assays, using whole bone marrow cells from mice of the indicated phenotype. Middle and right graphs; composition of erythroids and myeloids assayed by colony assays, using whole bone marrow cells from mice of the indicated phenotype an incubated with the mouse T1000 aptamer. N = 7 for wt and Terc -/- mice and N = 5 for Tert -/- mice. b Induced-pluripotent stem cell (iPSC) workflow. c Composition of erythroids and myeloids assayed by colony assays, using embryonic bodies (EBs) derived from the indicated iPSC lines treated with different aptamers. d Quantification of the hemogenic progenitors (HEPs) population (CD31 + /CD34 + /CD45-) by flow cytometry at day 15 in EBs. e mRNA levels of SPI1 assayed by RT-qPCR in the different conditions. The expression is normalized to GAPDH and relative to control sample. a Data are average of at least 5 biologically independent samples (wt, n = 7; Tert-/-, n = 5; Terc-/-, n = 7). Bars represent mean ± SEM. Statistical analysis according to 2way ANOVA followed by Dunnett’s multiple comparison test (95% confidence interval). c Data are average of 3 biologically independent samples. Bars represent mean ± SEM. Statistical analysis according to 2way ANOVA followed by Dunnett’s multiple comparison test (95% confidence interval). d Data are average of 3 biologically independent samples represented by dots. Bars represent mean ± SEM for each group. n.s., not significant, p > 0.05 according to Kruskal-Wallis followed by Dunn’s multiple comparison test (95% confidence interval). e Data are average of 3 biologically independent samples represented by dots. Bars represent mean ± SEM. Statistical analysis according to Kruskal-Wallis followed by Dunn’s multiple comparison test (95% confidence interval). Source data are provided as a Source Data file.

Acknowledgments
This image is the copyrighted work of the attributed author or publisher, and ZFIN has permission only to display this image to its users. Additional permissions should be obtained from the applicable author or publisher of the image. Full text @ Nat. Commun.