|
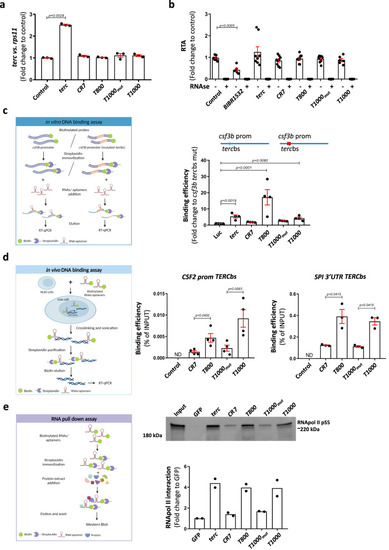
Aptamers physically bind to DNA and to RNApolII. aterc RNA levels determined by RT-qPCR in 48hpf larvae microinjected with full terc or the indicated aptamers. Gene expression was normalized to rps11 and then to the control sample. b Relative telomerase activity (RTA) measured by qPCR in protein extracts of 48 hpf larvae in the indicated conditions. c RT-qPCR of in vitro DNA-binding assay eluates showing the affinity for the wildtype csf3b promoter related to the csf3b promoter with mutated terc binding site (tercbs), and compared to Luc control. d RT-qPCR of in vivo DNA-binding assay eluates showing the affinity for the CSF2 promoter TERCbs or the SPI 3’UTR TERCbs. e Western blot and quantification of aptamer RNA pulldown eluates using anti-phospho-serine 5 RNA Pol II antibody. a Data are average of 3 biologically independent samples. Each dot represents a pool of 20 larvae. Bars represent mean ± SEM. Statistical analysis according to Kruskal-Wallis followed by uncorrected Dunn’s test (95% confidence interval). b Data are average of 3 independent experiments. Each dot represents a biologically independent sample consisting of a pool of 25 larvae (Control, n = 6; BIBR1532, n = 6; terc, n = 8; CR7, n = 6; T800, n = 9; T1000mut, n = 9; T1000, n = 9). Bars represent mean ± SEM. Statistical analysis according to Kruskal-Wallis followed by uncorrected Dunn’s test (95% confidence interval). c Data are average of 4 independent experiments. Bars represent mean ± SEM. Statistical analysis according to Kruskal-Wallis followed by Dunn’s multiple comparison test (95% confidence interval). d Data are average of 3-4 independent experiments. Bars represent mean ± SEM. Statistical analysis according to Kruskal-Wallis followed by uncorrected Dunn’s test (95% confidence interval). e Data are average of 2 independent experiments. Each dot represents a biologically independent sample consisting of a pool of 25 larvae. Bars represent mean. Images were created with BioRender.com by co-authors. Source data are provided as a Source Data file.
|