|
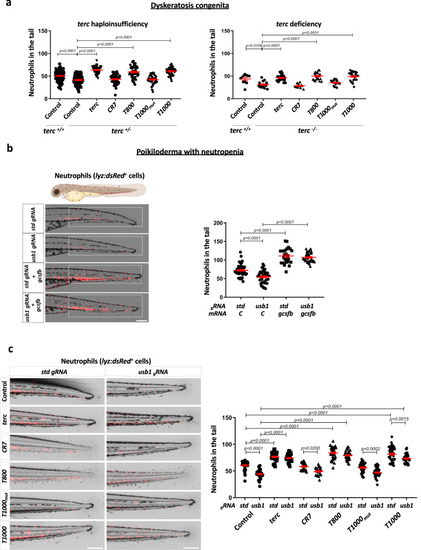
Aptamers rescue neutropenia in zebrafish models of DC and PN. a Neutrophils quantification at 48 hpf in terc +/- (obtained from mpx:GFP fish outcrossed with terc -/-) and terc -/- (obtained from a terc -/- incross) larvae microinyected with the indicated RNAs. terc -/- larvae were stained with TSA reagent to visualize neutophils. b Representative pictures and neutrophils (dsRed positive cells) quantification at 72 hpf in the tail of lyz:dsRED larvae microinjected with usb1 or std gRNA plus recombinant Cas9 in presence or absence of gcsfb mRNA. The white boxes show the quantified area. c Representative images and neutrophils quantification at 72 hpf in lyz:dsRED larval tail microinjected with usb1 or std gRNA plus recombinant Cas9 and the indicated aptamers. a Each dot represents a single larva (Left: +/+ Control, n = 126; +/- Control, n = 96; +/- terc, n = 48; +/- CR7, n = 52; +/- T800, n = 57; +/- T1000mut, n = 52; +/- T1000, n = 54. Right: +/+ Control, n = 11; -/- Control, n = 16; -/- terc, n = 26; -/- CR7, n = 11; -/- T800, n = 20; -/- T1000mut, n = 24; -/- T1000, n = 25). Mean ± SEM for each group is also shown. Left: Statistical analysis according to ordinary 1way ANOVA followed by Dunnett’s multiple comparison test (95% confidence interval). Right: Statistical analysis according to Kruskal-Wallis followed by Dunn’s multiple comparison test (95% confidence interval). b Data are average of 3 independent experiments. Each dot represents a single larva (Control+gstd, n = 41; Control+gusb1, n = 40; gcsfb+gstd, n = 25; gcsfb+gusb1, n = 37). Mean ± SEM for each group is also shown. Statistical analysis according to ordinary 1way ANOVA followed by Dunnett’s multiple comparison test (95% confidence interval). Scale bar: 250 um. c Data are average of 3 independent experiments. Each dot represents a single larva (Control+gstd, n = 42; Control+gusb1, n = 36; terc+gstd, n = 46; terc+gusb1, n = 39; CR7+gstd, n = 21; CR7+gusb1, n = 22; T800+gstd, n = 39; T800+gusb1, n = 32; T1000mut+gstd, n = 38; T1000mut+gusb1, n = 38; T1000+gstd, n = 42; T1000+gusb1, n = 39). Mean ± SEM for each group is also shown. Statistical analysis according to ordinary 1way ANOVA followed by Sidak’s multiple comparison test (95% confidence interval). Scale bar: 250 um. Image was created with BioRender.com by co-Authors. Source data are provided as a Source Data file.
|