|
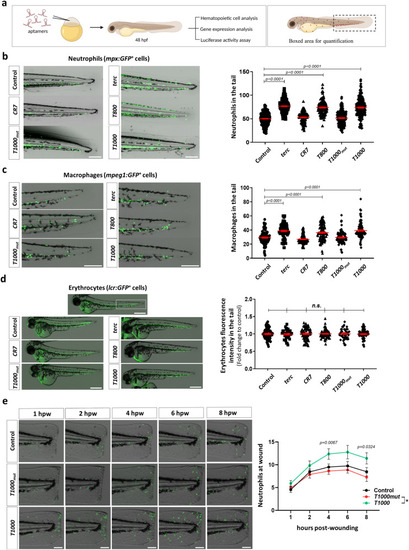
T800 and T1000 aptamers enforce myelopoiesis in zebrafish. a General workflow (created with Bio Render). Representative pictures of mpx:GFP (b) and mpeg1:GFP (c) larvae tail and lcr:GFP (d) complete larvae by 48 h post-fertilization (hpf) microinjected with the indicated aptamers. Right panels show quantification of neutrophils (b), macrophages (c) and erythrocyte fluorescence intensity in the white boxed area (d). e Representative images of mpx:GFP larvae transected tails from 1 to 8 h post-wounding (hpw) and quantification of neutrophil migration to the wound as neutrophil number mean±s.e.m. for all larvae. b Data are average of 5 independent experiments. Each dot represents a single larva (Control, n = 315; terc, n = 223; CR7, n = 120; T800, n = 151; T1000mut, n = 224; T1000, n = 219). Mean ± SEM for each group is also shown. Statistical analysis according to ordinary 1way ANOVA followed by Dunnett’s multiple comparison test (95% confidence interval). Scale bar: 250 um. c Data are average of 3 independent experiments. Each dot represents a single larva (Control, n = 97; terc, n = 84; CR7, n = 88; T800, n = 93; T1000mut, n = 92; T1000, n = 102). Mean ± SEM for each group is also shown. Statistical analysis according to ordinary 1way ANOVA followed by Dunnett’s multiple comparison test (95% confidence interval). Scale bar: 250 um. d Data are average of 3 independent experiments. Each dot represents a single larva (Control, n = 72; terc, n = 34; CR7, n = 75; T800, n = 71; T1000mut, n = 46; T1000, n = 75). Mean ± SEM for each group is also shown. n.s., not significant, p > 0.05 according to ordinary 1way ANOVA followed by Dunnett’s multiple comparison test (95% confidence interval). Scale bar: 500 um. e Data are shown as mean ± SEM of 3 independent experiments (Control, n = 30; T1000mut, n = 38; T1000, n = 43). Differences are statistically significant between T1000mut and T1000 groups. Statistical analysis according to mixed-effects analysis followed by Tukey’s multiple comparison test (95% confidence interval). Scale bar: 100 um. Image was created with BioRender.com by co-Authors. Source data are provided as a Source Data file.
|