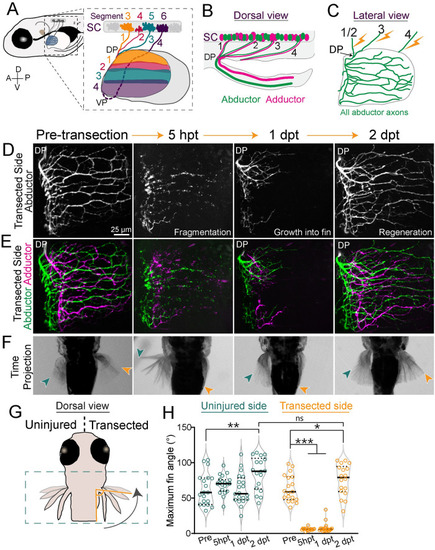
Pectoral fin motor axons regenerate robustly and reform functional synapses.

(A) Schematic of a 5 dpf larval zebrafish. Inset shows motor pools from SC segments 3–6 that form pectoral fin nerves 1–4 in the body wall. Axons sort at a DP or VP and innervate the musculature of the pectoral fin topographically. Innervation domains are labeled 1–4 and shown in corresponding colors. (B) Dorsal view. Motor neurons in SC segments innervate either the abductor or adductor muscle. (C) Lateral view. Schematic of abductor innervation of the pectoral fin. Nerves were transected using a laser in the locations shown with the lightning bolts. (D, E) Images from the transected side of maximum projections of fin motor innervation labeled with Tubb:dsRed. This example is from the same animal through regeneration. At 5 h hpt, axons have fragmented. At 1 dpt, axons have started to grow into the fin. At 2 dpt, axons have regenerated. (D) Abductor muscle innervation. (E) Abductor and adductor innervation pseudo-colored in green and magenta, respectively. (F) Corresponding time projections (<700 ms) of spontaneous pectoral fin movements. The region shown is indicated by the green dotted box in G. Only the nerves of the right fin were transected. At 5 hpt, the transected fin does not move. At 1 dpt, axons have just begun to grow into the fin but the transected fin still does not move. However, by 2 dpt, axons have regenerated and the transected fin can move again. The green and orange arrows point to the maximum fin position for the uninjured and transected sides, respectively. (G) The maximum angle of the tip of the fin compared to the body wall was measured during spontaneous fin movements. (H) Quantification of the maximum angle of the uninjured and transected fins pre-transection through regeneration. Each dot represents 1 fish and 1 movement. The black bar represents the mean. One-way ANOVA. *p = 0.04, **p < 0.005, ***p < 0.0001, ns = not significant. Original data for panel H is in S1 Data. dpf, day post fertilization; dpt, day post transection; DP, dorsal plexus; hpt, hour post transection; SC, spinal cord; VP, ventral plexus.

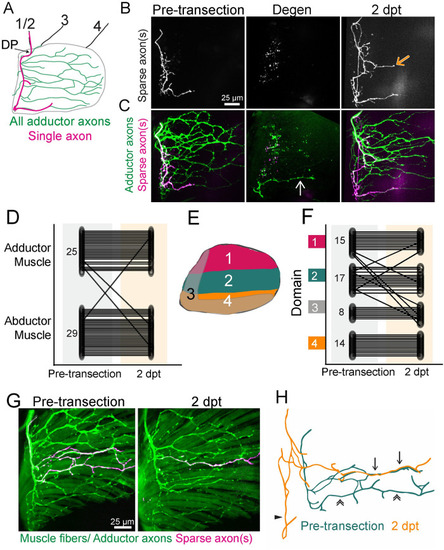
Target-selective regeneration of motor axons.

(A) Schematic of a lateral view of pectoral fin abductor muscle motor innervation. An example trajectory of a single axon is shown in magenta. DP labels dorsal plexus, motor nerves in the body wall are labeled 1–4. (B, C) A timecourse of sparsely labeled axon(s) showing the innervation pattern pre-transection, after axon degeneration, and at 2 dpt. Sparsely labeled axons are labeled in white (B) and magenta (C) and all adductor motor axons are labeled in green (C). The white arrow points to a fascicle that did not degenerate and the orange arrow points to ectopic growth during regeneration. (D) Quantification of the muscle localization of sparsely labeled axons pre-transection compared to where these labeled axons innervated after regeneration. Small numbers on pre-transection data represent n. Diagonal lines indicate the axon mistargeted during regeneration. (E) Schematic defining domains for axon domain scoring. For category 3, which are the minority, axons entered the fin at the DP but innervated the ventral region of the fin, overlapping with domain 4 (like the sparsely labeled axon in A). The domains used to quantify sparsely labeled axon targeting are a broader categorization than the topographic territories schematized in Fig 1A. (F) Quantification of fin domain localization of sparsely labeled axons pre-transection compared to where these labeled axons innervated after regeneration. Small numbers on pre-transection data represent n. (G) Example of sparsely labeled axons (magenta) that form new trajectories and reestablish previous trajectories during regeneration with both motor axons (mnx1:GFP) and muscle fibers (α-actin:GFP) labeled. (H) The original (green) and regenerated (orange) trajectories of the sparsely labeled axons in G. Here, part of the pre-injury and regenerated trajectory can be overlayed precisely (arrows). Additionally, an axon does not follow its original trajectory (double arrows) but instead is mistargeted along the base of the fin (triangle). Original data for panels D and F are in S1 Data. DP, dorsal plexus; dpt, day post transection; GFP, green fluorescent protein.

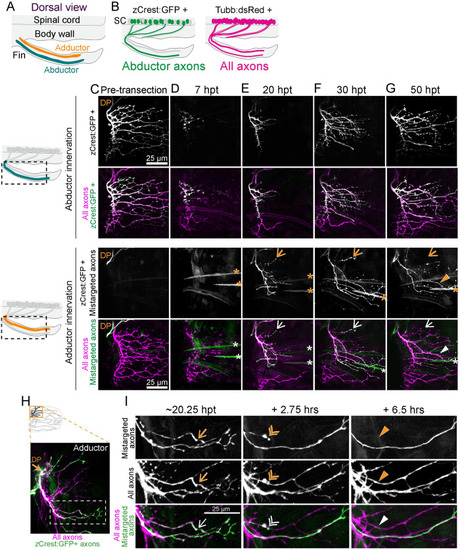
Mistargeted axons are selectively retracted.

(A) Dorsal view schematic labeling abductor and adductor musculature of the fin. (B) Schematic of zCrest:GFP+ motor neurons, which project to the abductor muscle and Tubb:dsRed+ motor neurons, which project to both abductor and adductor muscles. zCrest:GFP+ motor neurons are also labeled with Tubb:dsRed. (C–G) Timecourse of regeneration of innervation on abductor (top) and adductor (bottom) musculature. Schematics on the left show the area included in maximum projections. Arrows point to mistargeted axons that will retract. Asterisks indicate muscle fibers also labeled by zCrest:GFP. DP labels dorsal plexus. (C) zCrest:GFP+ axons are not present on the adductor muscle before axon transection. (D) At 7 hpt, axons have fragmented. (E) At 20 hpt, regenerating zCrest:GFP+ axons are present on both the abductor and adductor muscle. (F, G) At 30 and 50 hpt, some zCrest:GFP+ mistargeted axons have retracted (arrow), whereas other mistargeted axons persist (triangle). (H) Maximum projection of axon regeneration onto adductor muscle at 20.25 hpt. The boxed region is expanded in I. zCrest:GFP+ axons are mistargeted onto adductor muscle. (I) Images from timelapse imaging of axon regeneration onto adductor muscle. zCrest:GFP labels mistargeted axons, whereas axons that are only magenta (labeled with Tubb:dsRed) are correctly targeted to adductor muscle. Example of a mistargeted axon that is present at 20.25 hpt (arrow), retracting at +2.75 h (double arrowhead) and gone by +6.5 h (filled triangle). DP, dorsal plexus; GFP, green fluorescent protein; hpt, hour post transection.

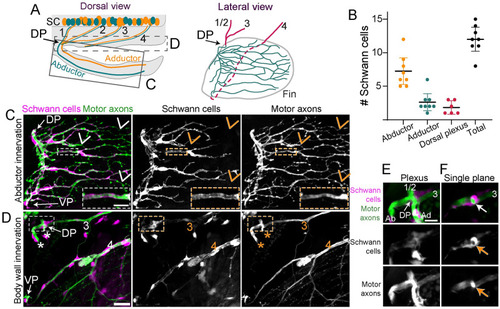
Schwann cells tightly associate with axons in the pectoral fin.

(A) Schematic of a dorsal view of a larval zebrafish. In the SC, motor axons that sort at the DP to innervate the abductor (green) or adductor (orange) muscle are mixed within nerves 1–3. Nerve 4 axons sort at the VP (not labeled). The C and D boxes denote the regions included in the maximum projections shown in C and D. The lateral view shows the arrangement of nerves 1–4 in the body wall (magenta) and innervation in the fin (green) as it is shown in C and D. The dashed line indicates where nerve 4 grows in the body wall behind the fin. (B) Quantification of number of Schwann cells on the abductor or adductor muscle or associated with the plexus; n = 8 pectoral fins. Data are represented as mean ± 95% CI. (C) Maximum projection of abductor innervation labeled with Tubb:dsRed and 37a> EGFP to label Schwann cells. VP labels ventral plexus. Inset shows Schwann cell membranes that surround axon fascicles within the pectoral fin. Arrows point to axons that are not associated with Schwann cells. (D) Maximum projection of body wall innervation of the same larvae shown in C. Nerves 3 and 4 are labeled. Inset shows DP expanded in E and F. Asterisks label the dorsal region of abductor and adductor innervation. The rest of the fin innervation is not included in this maximum projection. (E) Maximum projection of the dorsal plexus with a single plane shown in (F). Abductor (Ab) and adductor (Ad) innervation and nerves 1/2 and 3 are labeled. The arrow in F points to Schwann cell membranes that completely wrap axonal fascicle in the plexus. Scale bars are 25 microns for C and D and 10 microns for the inset in C, E, and F. Original data for panel B is in S1 Data. DP, dorsal plexus; SC, spinal cord; VP, ventral plexus.

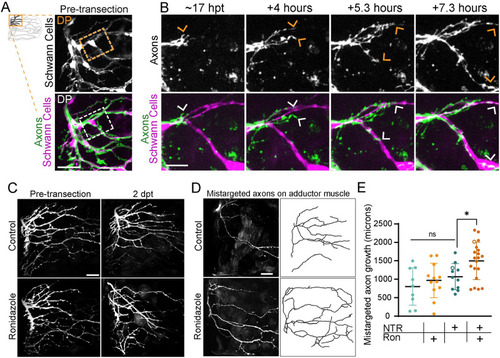
Schwann cells instruct axonal regrowth.

(A) Pre-transection maximum projection of axons labeled with Tubb:dsRed and Schwann cells labeled with 37a> EGFP. Boxed inset outlines the region shown in B. DP labels the dorsal plexus. (B) Timelapse imaging captures pioneer axons (arrows) navigating a choice point. Axons remain tightly associated with Schwann cell membranes. (C) Maximum projections of abductor-specific innervation labeled with zCrest:GFP in animals that also express 37a> NTR-tagRFP before injury and at 2 dpt. The addition of ronidazole ablated Schwann cells. (D) Maximum projection and traces of mistargeted zCrest:GFP-labeled axons on the adductor muscle in 37a> NTR-tagRFP animals treated with ronidazole or control. (E) Quantification of total amount of mistargeted zCrest:GFP+ axon growth on adductor muscle. Data points labeled with hollow circles denote the examples shown in D. Data are represented as mean ± SD. *p < 0.05, ns = not significant. One way ANOVA. Scale bars are 10 microns (B) and 25 microns (A, C, and D). Original data for panel E is in S1 Data. DP, dorsal plexus; dpt, day post transection; GFP, green fluorescent protein.

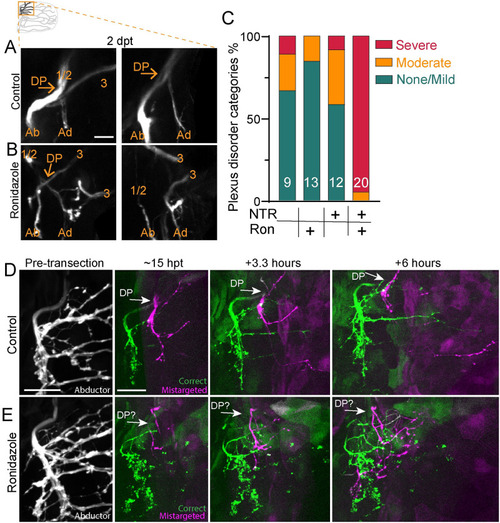
Schwann cells organize axon regeneration through the plexus.

(A) Maximum projection of the DP of zCrest:GFP to label abductor-specific axons at 2 dpt from 2 control animals. Schwann cells also express 37a> NTR-tagRFP. Nerves 1/2 and 3, the DP, and the abductor (Ab) and adductor (Ad) innervation are labeled. Both were categorized as “none/mild” plexus disorder. (B) Two examples of plexus disorganization category “severe” in animals with Schwann cells ablated after adding ronidazole. (C) Categorization of plexus organization in regenerated fins. Numbers indicate n. NTR = nitroreductase, Ron = ronidazole. (D, E) Timelapse imaging during regeneration of zCrest:GFP. (D) In the control, the plexus is organized with fascicles correctly targeting the abductor muscle (green) and incorrectly targeting the adductor muscle (magenta). Axons extend orderly projections into the fin musculature; n = 4/5 (E). When Schwann cells are ablated after adding ronidazole, axon growth through the plexus is disorganized and axons are defasciculated; n = 4/4. Scale bars are 25 microns (D, E) and 10 microns (A). Original data for panel C is in S1 Data. DP, dorsal plexus; dpt, day post transection; GFP, green fluorescent protein.

Acknowledgments
This image is the copyrighted work of the attributed author or publisher, and ZFIN has permission only to display this image to its users. Additional permissions should be obtained from the applicable author or publisher of the image. Full text @ PLoS Biol.