IMAGE

Fig 5

ID
ZDB-IMAGE-230916-115
Source
Figures for Walker et al., 2023
Image
Figure Caption

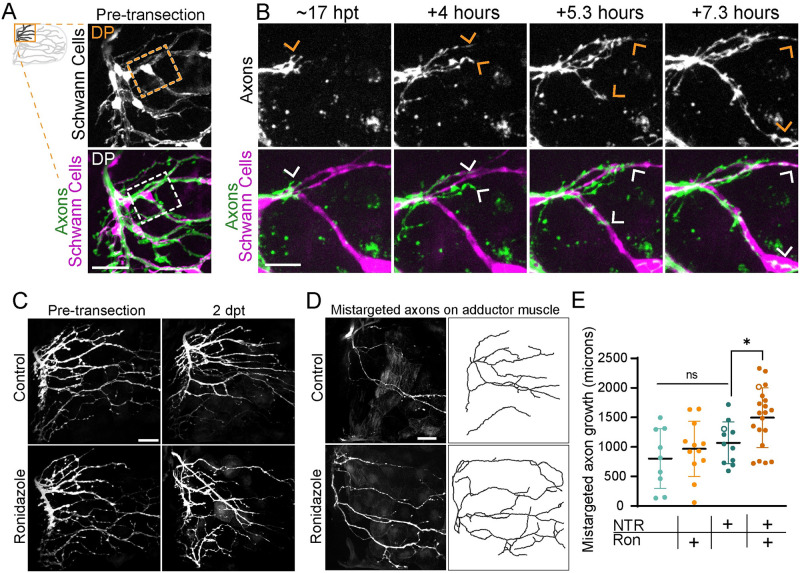
Fig 5 Schwann cells instruct axonal regrowth.

(A) Pre-transection maximum projection of axons labeled with Tubb:dsRed and Schwann cells labeled with 37a> EGFP. Boxed inset outlines the region shown in B. DP labels the dorsal plexus. (B) Timelapse imaging captures pioneer axons (arrows) navigating a choice point. Axons remain tightly associated with Schwann cell membranes. (C) Maximum projections of abductor-specific innervation labeled with zCrest:GFP in animals that also express 37a> NTR-tagRFP before injury and at 2 dpt. The addition of ronidazole ablated Schwann cells. (D) Maximum projection and traces of mistargeted zCrest:GFP-labeled axons on the adductor muscle in 37a> NTR-tagRFP animals treated with ronidazole or control. (E) Quantification of total amount of mistargeted zCrest:GFP+ axon growth on adductor muscle. Data points labeled with hollow circles denote the examples shown in D. Data are represented as mean ± SD. *p < 0.05, ns = not significant. One way ANOVA. Scale bars are 10 microns (B) and 25 microns (A, C, and D). Original data for panel E is in S1 Data. DP, dorsal plexus; dpt, day post transection; GFP, green fluorescent protein.

Acknowledgments
This image is the copyrighted work of the attributed author or publisher, and ZFIN has permission only to display this image to its users. Additional permissions should be obtained from the applicable author or publisher of the image. Full text @ PLoS Biol.