FIGURE SUMMARY
Title

Regionalized Protein Localization Domains in the Zebrafish Hair Cell Kinocilium

Authors
Erickson, T., Biggers, W.P., Williams, K., Butland, S.E., Venuto, A.
Source
Full text @ J Dev Biol

Identification of cilium-associated genes with enriched expression in zebrafish hair cells. (A) Diagram of a generic sensory hair cell. (B) Scatter plot of differentially expressed genes identified by TU-tagging. ankef1a, odf3l2a, and saxo2 are indicated in the 4TU-UPRT-enriched population. (CE) mRNA in situ hybridization (ISH) for ankef1a, odf3l2a, and saxo2 in zebrafish larvae at 3 days post-fertilization (dpf). NMs = neuromasts; OE = olfactory epithelium. In the ankef1a and saxo2 posterior macula panels, arrows point to the posterior macula sensory patch and asterisks indicate the out-of-focus anterior macula. (F) Schematic of transgenic constructs used in this study. (G) Overview of Ankef1a-GFP (1), Odf3l2a-GFP (2), Saxo2-GFP (3), Saxo2-mKate2 (4), YFP-TUBA (5), and Actb1-GFP (6) protein localization in the lateral cristae of larval zebrafish at 5–6 dpf. Scale bars are 100 µm for the headshots in (CE), and 20 µm for all other ISH panels. Scale bars are 5 µm in (G).

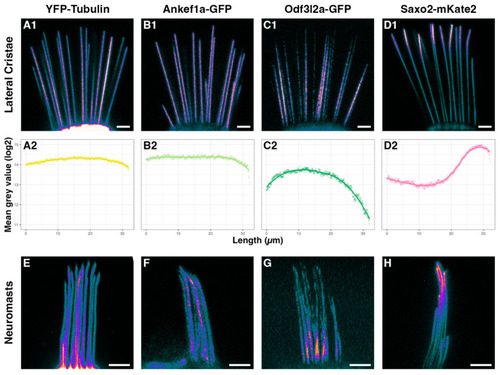
Distributions of tubulin, Ankef1a, Odf3l2a, and Saxo2 in the hair cell kinocilium at 5–6 dpf. (A1D1) Pixel intensity-encoded images of tagged alpha-tubulin, Ankef1a, Odf3l2a, and Saxo2 proteins in the kinocilia of lateral cristae hair cells. Brighter colours indicate higher fluorescence intensity. (A2D2) Scatter plots of averaged mean grey values (log2) for fluorescence intensity from kinocilia in the lateral cristae of YFP-TUBA (n = 35 kinocilia from 8 individuals), Ankef1a-GFP (n = 23 from 8 individuals), Odf3l2a-GFP (n = 30 from 11 individuals), and Saxo2-mKate2 (n = 17 from 6 individuals). Position 0 µm is from the proximal region near the base of kinocilia and position 32 µm is the distal-most tip. (EH) Pixel intensity-encoded images of neuromast kinocilia from YFP-TUBA, Ankef1a-GFP, Odf3l2a-GFP, and Saxo2-mKate2 expressing zebrafish larvae. Scale bars are 5 µm in panels (A1D1,EH).

Distinct protein localization patterns in the hair cell soma. (AD) Details of YFP-TUBA, Ankef1a-GFP, Odf3l2a-GFP, and Saxo2-mKate2 in the hair cell body at 5–6 dpf. The top panels are black-and-white representations of the fluorescence channel and the lower panels overlay the fluorescence channel with the corresponding light image. (E,F) Saxo2-mKate2 (magenta) accumulations in the apical part of the hair cell body in cristae and neuromasts. GFP-tagged beta-actin is shown in green. cp = cuticular plate; k = kinocilium; mt = microtubule; n = nucleus; sc = stereocilia; scz = subcuticular zone. Scale bars are 5 µm in (AD) and 2.5 µm in (E,F).

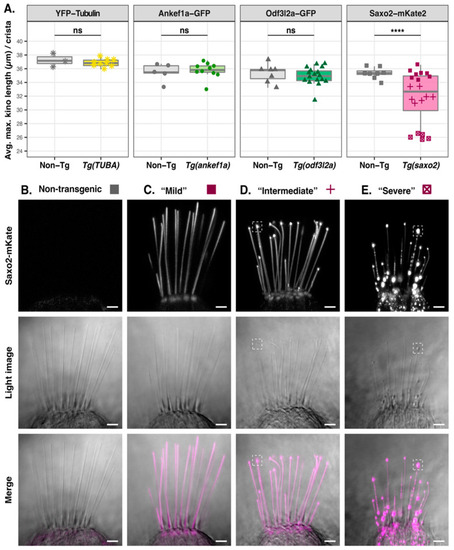
Effect of tubulin, Ankef1a, Odf3l2a, and Saxo2 overexpression on kinocilial length and morphology at 5–6 dpf. (A) Boxplots of maximum kinocilia length in the lateral crista of YFP-TUBA, ankef1a-GFP, odf3l2a-GFP, and saxo2-mKate2 transgenics and their non-transgenic siblings. Data points are the average length of the five tallest kinocilia from an individual larva. Based on the morphological phenotypes of the three Saxo2-mKate2 transgenic lines, these data points are grouped as “mild” (solid squares), “intermediate” (crosses), and “severe” (boxed x’s). Two-tailed Welch’s t-test statistics—YFP-tubulin (6 dpf): non-Tg, n = 3 larvae, mean = 37.3 µm; Tg(TUBA), n = 9, mean = 36.9 µm; t = 0.67757, df = 2.5116, p = 0.5551. Ankef1a-GFP (5 dpf): non-Tg, n = 5, mean = 35.5 µm; Tg(ankef1a), n = 10, mean = 35.7 µm; t = 0.41384, df = 7.079, p = 0.6912. Odf3l2a-GFP (5 dpf): non-Tg, n = 7, mean = 35.3 µm; Tg(odf3l2a), n = 17, mean = 35.0 µm; t = 0.5913, df = 10.931, p = 0.5663. Saxo2-mKate2 (5 dpf) one-way ANOVA (F3,24 = 193.3, p < 2 × 10⁻¹⁶). See text for results of pairwise comparisons between the Saxo2-mKate2 phenotypes. (BE) Representative images of lateral cristae from non-transgenic (B) and saxo2-mKate2 transgenics categorized as “mild” (C), “intermediate” (D), and “severe” (E). The dashed boxes in (D,E) highlight examples of the “bulbed” kinocilial phenotype. ns = not significant; **** = p < 0.00001. Scale bars are 5 µm.

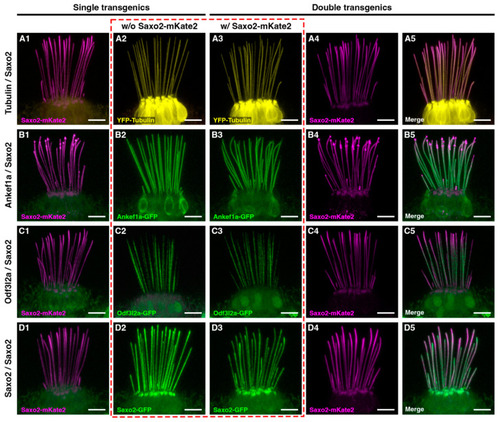
Co-expression of Saxo2-mKate2 with YFP-tubulin (A), Ankef1a-GFP (B), Odf3l2a-GFP (C), and Saxo2-GFP (D) at 5–6 dpf. Column 1 and 2 of each row shows single transgenic siblings, whereas columns 3 and 4 show individual channels from a double transgenic larva. Column 5 shows the merged channels from columns 3 and 4. The dashed red box compares YFP-TUBA, Ankef1a-GFP, Odf3l2a-GFP, and Saxo2-GFP localization without (A2D2) or with (A3D3) the presence of Saxo2-mKate2. Scale bars are 5 µm in all panels.

Summary of kinocilial localization patterns and phenotypes for Ankef1a, Odf3l2a, and Saxo2 transgenic proteins compared to tubulin.

Acknowledgments
This image is the copyrighted work of the attributed author or publisher, and ZFIN has permission only to display this image to its users. Additional permissions should be obtained from the applicable author or publisher of the image. Full text @ J Dev Biol