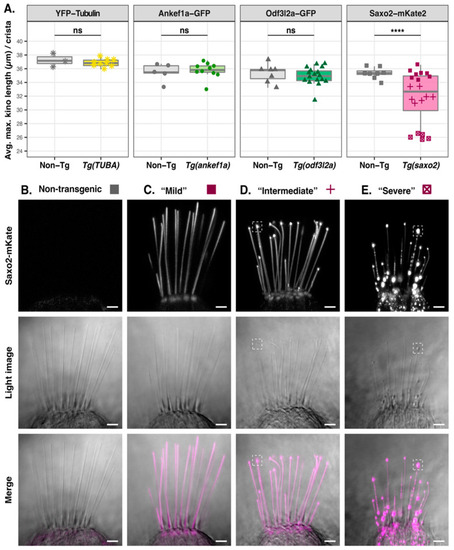
Effect of tubulin, Ankef1a, Odf3l2a, and Saxo2 overexpression on kinocilial length and morphology at 5–6 dpf. (A) Boxplots of maximum kinocilia length in the lateral crista of YFP-TUBA, ankef1a-GFP, odf3l2a-GFP, and saxo2-mKate2 transgenics and their non-transgenic siblings. Data points are the average length of the five tallest kinocilia from an individual larva. Based on the morphological phenotypes of the three Saxo2-mKate2 transgenic lines, these data points are grouped as “mild” (solid squares), “intermediate” (crosses), and “severe” (boxed x’s). Two-tailed Welch’s t-test statistics—YFP-tubulin (6 dpf): non-Tg, n = 3 larvae, mean = 37.3 µm; Tg(TUBA), n = 9, mean = 36.9 µm; t = 0.67757, df = 2.5116, p = 0.5551. Ankef1a-GFP (5 dpf): non-Tg, n = 5, mean = 35.5 µm; Tg(ankef1a), n = 10, mean = 35.7 µm; t = 0.41384, df = 7.079, p = 0.6912. Odf3l2a-GFP (5 dpf): non-Tg, n = 7, mean = 35.3 µm; Tg(odf3l2a), n = 17, mean = 35.0 µm; t = 0.5913, df = 10.931, p = 0.5663. Saxo2-mKate2 (5 dpf) one-way ANOVA (F3,24 = 193.3, p < 2 × 10⁻¹⁶). See text for results of pairwise comparisons between the Saxo2-mKate2 phenotypes. (B–E) Representative images of lateral cristae from non-transgenic (B) and saxo2-mKate2 transgenics categorized as “mild” (C), “intermediate” (D), and “severe” (E). The dashed boxes in (D,E) highlight examples of the “bulbed” kinocilial phenotype. ns = not significant; **** = p < 0.00001. Scale bars are 5 µm.
|
