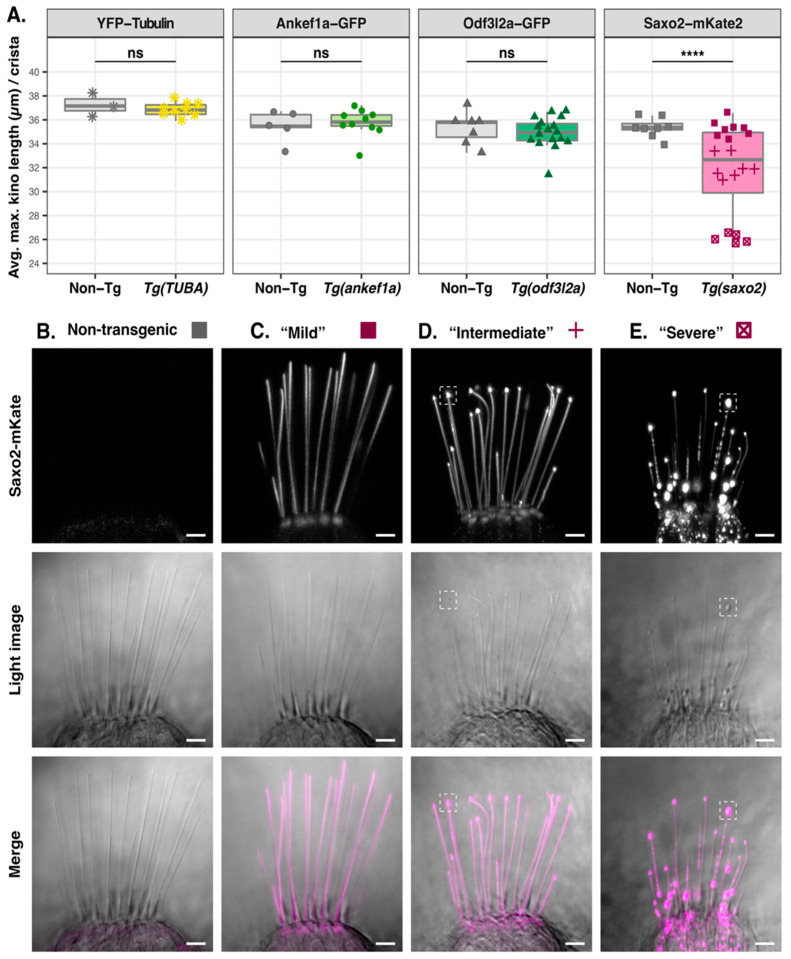
Effect of tubulin, Ankef1a, Odf3l2a, and Saxo2 overexpression on kinocilial length and morphology at 5–6 dpf. (A) Boxplots of maximum kinocilia length in the lateral crista of YFP-TUBA, ankef1a-GFP, odf3l2a-GFP, and saxo2-mKate2 transgenics and their non-transgenic siblings. Data points are the average length of the five tallest kinocilia from an individual larva. Based on the morphological phenotypes of the three Saxo2-mKate2 transgenic lines, these data points are grouped as “mild” (solid squares), “intermediate” (crosses), and “severe” (boxed x’s). Two-tailed Welch’s t-test statistics—YFP-tubulin (6 dpf): non-Tg, n = 3 larvae, mean = 37.3 µm; Tg(TUBA), n = 9, mean = 36.9 µm; t = 0.67757, df = 2.5116, p = 0.5551. Ankef1a-GFP (5 dpf): non-Tg, n = 5, mean = 35.5 µm; Tg(ankef1a), n = 10, mean = 35.7 µm; t = 0.41384, df = 7.079, p = 0.6912. Odf3l2a-GFP (5 dpf): non-Tg, n = 7, mean = 35.3 µm; Tg(odf3l2a), n = 17, mean = 35.0 µm; t = 0.5913, df = 10.931, p = 0.5663. Saxo2-mKate2 (5 dpf) one-way ANOVA (F3,24 = 193.3, p < 2 × 10⁻¹⁶). See text for results of pairwise comparisons between the Saxo2-mKate2 phenotypes. (B–E) Representative images of lateral cristae from non-transgenic (B) and saxo2-mKate2 transgenics categorized as “mild” (C), “intermediate” (D), and “severe” (E). The dashed boxes in (D,E) highlight examples of the “bulbed” kinocilial phenotype. ns = not significant; **** = p < 0.00001. Scale bars are 5 µm.
Acknowledgments
This image is the copyrighted work of the attributed author or publisher, and
ZFIN has permission only to display this image to its users.
Additional permissions should be obtained from the applicable author or publisher of the image.
Full text @ J Dev Biol
Your Input Welcome
Thank you for submitting comments. Your input has been emailed to ZFIN curators who may contact you if
additional information is required.
Oops. Something went wrong. Please try again later.