
- Title
-
ROS signaling-induced mitochondrial Sgk1 expression regulates epithelial cell renewal
- Authors
- Li, Y., Liu, C., Rolling, L., Sikora, V., Chen, Z., Gurwin, J., Barabell, C., Lin, J., Duan, C.
- Source
- Full text @ Proc. Natl. Acad. Sci. USA
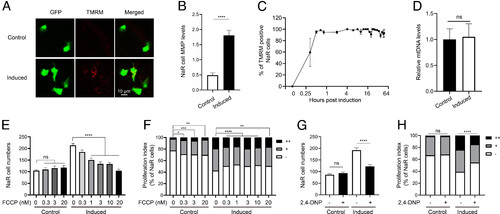
Elevated mitochondrial membrane potential (MMP) promotes NaR cell reactivation. (A and B) MMP levels in the control and reactivated NaR cells. Tg(igfbp5a:GFP) larvae (3 dpf) were transferred to the control or induction medium. Two days later, MMP levels in NaR cells were measured after TMRM staining and normalized by GFP signal. Representative images are shown in A and quantified results in B. n = 221 to 447 cells from multiple fish. (C) Time course of MMP change. Tg(igfbp5a:GFP) larvae (3 dpf) were transferred to the induction medium. A subset of larvae were randomly sampled at the indicated time point and % of TMRM-positive NaR cells was measured and shown. n = 2 to 6 fish/time point. (D) Mitochondrial DNA levels. NaR cells were isolated by FACS from fish described in A and B. The levels of mitochondrial 16S rRNA gene were measured and normalized by the levels of nuclear aryl hydrocarbon receptor 2 gene. n = 4. (E−H) Tg(igfbp5a:GFP) larvae (3 dpf) were transferred to the control or induction medium containing the indicated concentration of FCCP. (E and F) or 1 μM 2,4-DNP. (G and H). Two days later, NaR cell number (E and G) and NaR cell proliferation index (F and H) were determined and shown. n = 11 to 26 fish/group. The cell proliferation index was determined by counting NaR cells that divided 0, 1, or 2 times (denoted by −, +, and ++, respectively) over the course of the experiment and presented as % of total NaR cells. All other data are shown as mean ± SEM. ns, not significant. *, **, ***, and **** indicate P < 0.05, 0.01, 0.001, and 0.0001, respectively. |
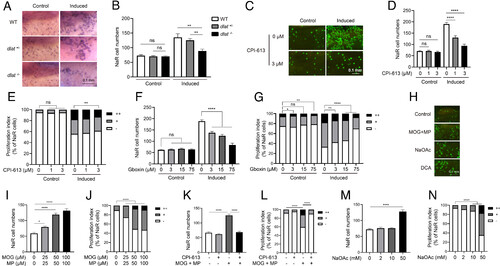
Elevated mitochondrial metabolism is required and sufficient to reactivate NaR cells. (A and B) Genetic disruption of the PDH complex impairs NaR cell reactivation. The progenies of dlat+/− intercrosses were transferred to the control or induction medium at 3 dpf. Two days later, NaR cells were labeled by in situ hybridization and quantified. Fish were genotyped individually afterward. Representative images are shown in A and NaR cell number in B. n = 13 to 40 fish/group. (C–E) Effect of CPI-613. Tg(igfbp5a:GFP) larvae (3 dpf) were transferred to the control or induction medium containing the indicated doses of CPI-613. Two days later, NaR cell number (D) and proliferation index (E) were measured and shown. Representative images are shown in C. n = 25 to 31 fish/group. (F and G) Effect of Gboxin. Tg(igfbp5a:GFP) embryos were raised and treated as described in C with the indicated doses of Gboxin. NaR cell number (F) and proliferation index (G) were measured and shown. n = 24 to 33 fish/group. (H–N) Effects of dimethyl 2-oxoglutarate (MOG)+methyl pyruvate (MP), sodium acetate (NaOAc), and CPI-613 (3 μM). Tg(igfbp5a:GFP) larvae were transferred to the control medium containing the indicated chemicals at 3 dpf. Two days later, NaR cell number (I, K, and M) and proliferation index (J, L, and N) were measured and shown. n = 15 to 31 fish/group. Representative images are shown in H. The proliferation index results are shown as % of total NaR cells counted. All other data are shown as mean ± SEM. ns, not significant. *, **, ***, and **** indicate P < 0.05, 0.01, 0.001, and 0.0001, respectively. |
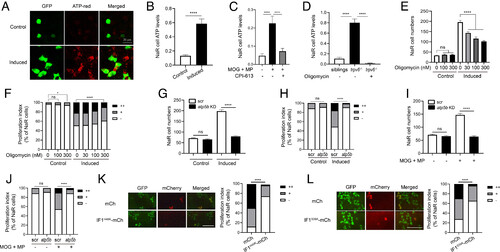
NaR cell reactivation requires ATP synthesis. (A and B) ATP levels. Tg(igfbp5a:GFP) larvae (3 dpf) were transferred to the control or induction medium. After 18 h, NaR cell mitochondrial ATP levels were measured. Representative images are shown in A and quantified results in B. n = 205 to 447 cells from multiple fish. (C) Effects of MOG + MP and CPI-613. Tg(igfbp5a:GFP) fish (3 dpf) were transferred to the control medium containing DMSO, 100 μM MOG + 100 μM MP, and/or 3 μM CPI-613. Five hours later, NaR cell mitochondrial ATP levels were measured and shown. n = 157 to 233 cells from multiple fish. (D) Elevated mitochondrial ATP levels in trpv6−/− NaR cells. Progeny from trpv6+/−; Tg(igfbp5a:GFP) intercrosses were raised to 3 dpf. They were transferred to the control medium with or without 200 nM oligomycin. After measuring NaR cell mitochondrial ATP levels, the genotype of each fish was determined. n = 112 to 315 cells from multiple fish. (E and F) Effect of oligomycin. Tg(igfbp5a:GFP) fish (3 dpf) were transferred to the control or induction medium containing oligomycin at the indicated concentrations. Two days later, NaR cell number (E) and proliferation index (F) were measured and shown. n = 12 to 34 fish/group. (G−J) CRISPR-Cas9-mediated atp5b deletion. Tg(igfbp5a:GFP) embryos injected with targeting gRNAs and Cas9 mRNA were raised to 3 dpf and transferred to the control or induction medium without (G and H) or with 100 μM MOG + 100 μM MP (I and J). Two days later, NaR cell number (G and I) and proliferation index (H and J) were measured and shown. n = 14 to 42 fish/group. (K and L) NaR cell–specific expression of IF1H49K (K) or IF1S39A (L). Tg(igfbp5a:GFP) embryos injected with BAC-mCherry, BAC-IF1H49K, or BAC- IF1S39A-mCherry DNA were raised to 3 dpf and transferred to the induction medium. Two days later, NaR cells expressing the transgene were identified, and cell proliferation index was measured. Representative images are shown in the left panel and quantified data in the right. Scale bar represents 0.1 mm. n = 102 to 163 in K and n = 29 to 148 cells from multiple fish in L. The proliferation index data are shown as % of total NaR cells counted. All other data are shown as mean ± SEM. ns, not significant. *, **, ***, and **** indicate P < 0.05, 0.01, 0.001, and 0.0001, respectively. |
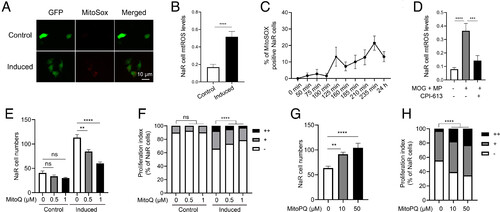
ROS signaling promotes NaR cell reactivation. (A and B) Mitochondrial reactive oxygen species (mtROS) levels. Tg(igfbp5a:GFP) larvae were transferred to the control or induction medium at 3 dpf. One day later, NaR cell mtROS levels were measured. Representative images are shown in A and quantified results in B. n = 201 to 390 cells from multiple fish. (C) Time course changes. Tg(igfbp5a:GFP) larvae (3 dpf) were transferred to the induction medium. A subset of larvae were randomly sampled at the indicated time point and % of MitoSOX-positive NaR cells was determined and shown. n = 4 fish/group. (D) Effects of MOG+MP and CPI-613. Tg(igfbp5a:GFP) larvae (3 dpf) were transferred to the control or induction medium with or without 100 μM MOG + MP and 3 μM CPI-613. One day later, NaR cell mtROS levels were measured and shown. n= 197 to 276 cells from multiple fish. (E and F) mtROS signaling is required. Tg(igfbp5a:GFP) larvae were transferred to the control or induction medium containing the indicated dose of MitoQ at 3 dpf. Two days later, NaR cell number (E) and proliferation index (F) were measured and shown. n = 15 to 42 fish/group. (G and H) ROS signaling is sufficient. Tg(igfbp5a:GFP) larvae were raised in the control medium containing the indicated concentrations of MitoPQ from 3 to 5 dpf. NaR cell number (G) and proliferation index (H) were measured and shown. n = 15 to 42 fish/group. The proliferation index results are shown as % of total NaR cells counted. All other data are shown as mean ± SEM. ns, not significant. *, **, ***, and **** indicate P < 0.05, 0.01, 0.001, and 0.0001, respectively. |
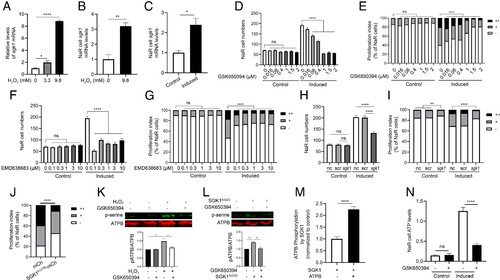
ROS signaling–induced Sgk1 mitochondrial expression is critical. (A) Induction of sgk1 expression by H2O2. Zebrafish larvae (3 dpf) were transferred to the control medium containing the indicated doses of H2O2. After 3 h, the larvae were collected and sgk1 mRNA levels measured. n = 4. (B) Expression and ROS induction of sgk1 mRNA in NaR cells. Tg(igfbp5a:GFP) larvae were treated with H2O2 at the indicated dose for 3 h. NaR cells were isolated by FACS sorting and analyzed by qRT-PCR. n = 3. (C) Increased sgk1 mRNA levels in reactivated NaR cells. NaR cells were isolated by FACS sorting from Tg(igfbp5a:GFP) larvae treated with the control or induction medium for 18 h. sgk1 mRNA levels were measured and shown. n = 4. (D–G) Effects of SGK1 inhibitors. Tg(igfbp5a:GFP) embryos (3 dpf) were transferred to the control or induction medium containing the indicated doses of GSK-650394 (D and E) or EMD638683 (F and G). Two days later, NaR cell number (D and F) and proliferation index (E and G) were determined as described in Fig. 1 and shown. n = 15 to 41 fish/group. (H and I) CRISPR/Cas9-mediated sgk1 deletion. Tg(igfbp5a:GFP) embryos were injected with sgk1 targeting gRNAs and Cas9 mRNA at the one-cell stage. They were raised to 3 dpf and transferred to the control or induction medium. Two days later, NaR cell number (H) and proliferation index (I) were measured and shown. n = 30 to 58 fish/group. (J) Effect of SGK1K127M expression in NaR cells. Tg(igfbp5a:GFP) embryos were injected with the indicated BAC-mCherry DNA at the one-cell stage. They were raised to 3 dpf and transferred to the induction medium. Two days later, cell proliferation index in mCherry-expressing NaR cells was determined and shown. n = 45 to 211 from multiple fish. (K) HEK293 cells were treated with DMSO or GSK650394 overnight, followed by 2-h H2O2 treatment (250 μM H2O2). Cells were subjected to IP using an anti-ATP5B antibody. The IP samples were analyzed by western blot using the indicated antibodies. Representative results are shown in the top panel. Ratio of phospho- and total ATP5B is shown at the bottom. n = 4. (L) HEK293 cells were transfected with Sgk1S422D-mcherry or an empty vector, followed by GSK650394 treatment. Cells were analyzed and shown as described in K. n = 3. (M) SGK1 phosphorylates ATP5B. n = 5. Human SGK1 was incubated with or without ATP5B, and changes in ATP5B phosphorylation were measured. (N) Elevated mitochondrial ATP synthesis in reactivated NaR cells is Sgk1 dependent. Tg(igfbp5a:GFP) larvae (3 dpf) were transferred to the control or induction medium for 14 h. They were then treated with DMSO or GSK650394 for 4 h. ATP levels were analyzed and shown. n = 178 to 609 cells from multiple fish. The proliferation index results are shown as % of total NaR cells counted. All other data are shown as mean ± SEM. ns, not significant. *, **, ***, and **** indicate P < 0.05, 0.01, 0.001, and 0.0001, respectively. |
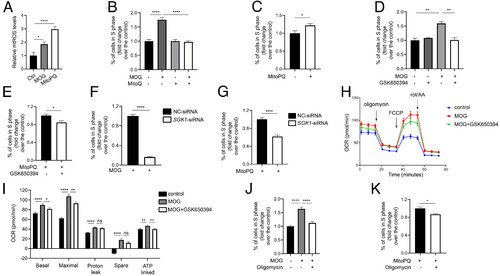
The mitochondrial metabolism–ROS–SGK1–ATP synthase signaling loop stimulates human breast cancer cell S phase entry. (A) MOG and MitoQ increase mtROS levels. MDA-MB-231 cells were treated with MOG (4 mM) or MitoPQ (5 μM) for 1 d. mtROS levels were measured and shown. n = 6. (B) mtROS signaling mediates MOG-induced cell proliferation. After MDA-MB-231 cells were treated with MOG (4 mM) and/or MitoQ (1 μM) for 2 d, % of cells in S phase was determined by flow cytometry and expressed as fold changes over the control group. n = 4. (C) Effect of MitoPQ. After MDA-MB-231 cells were treated with MitoPQ (5 μM) for 2 d, % of cells in S phase was determined and expressed as fold change over the control group. n = 7. (D and E) SGK1 mediates MOG- and MitoPQ-induced cell proliferation. MDA-MB-231 cells were treated with MOG (4 mM), MitoPQ (5 μM), and/or GSK650394 (20 μM) for 2 d. % of cells in S phase was determined and expressed as fold change over the control group. n = 3. (F and G) Knockdown of SGK1 abolishes MOG (F)- and MitoPQ (G)-induced cell proliferation. MDA-MB-231 cells were transfected with the control (NC-siRNA) or SGK1-siRNA. One day after transfection, MOG (4 mM) or MitoPQ (5 μM) was added. % of cells in S phase was determined 2 d later and expressed as fold change over the control group. n = 6. (H and I) Inhibition of SGK1 reduces oxygen consumption rate (OCR). MDA-MB-231 cells were treated with MOG and/or GSK650394 (20 μM) for 4 h and subjected to seahorse assays. Oligomycin, FCCP, and rotenone/AA were spiked into cells at various timepoints, and OCR was measured. Calculated parameters are shown in I. n = 8. Similar results were obtained in a separate experiment. (J and K) F1Fo-ATP synthase activity is required in MOG (J)- and ROS (K)-induced cell proliferation. After MDA-MB-231 cells were treated with MOG (4 mM), MitoPQ (5 μM), and/or oligomycin (5 μM) for 2 d, % of cells in S phase was determined and expressed as fold change over the control group. n = 6. Data are shown as mean ± SEM. ns, not significant. *, **, ***, and **** indicate P < 0.05, 0.01, 0.001, and 0.0001, respectively. |