
Fig. 6
- ID
- ZDB-FIG-231103-65
- Publication
- Li et al., 2023 - ROS signaling-induced mitochondrial Sgk1 expression regulates epithelial cell renewal
- Other Figures
- All Figure Page
- Back to All Figure Page
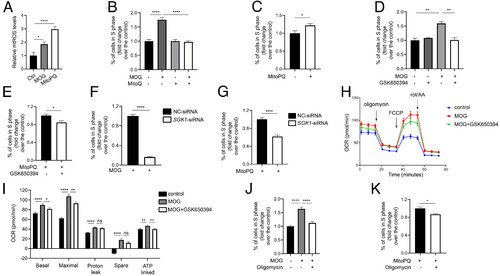
The mitochondrial metabolism–ROS–SGK1–ATP synthase signaling loop stimulates human breast cancer cell S phase entry. (A) MOG and MitoQ increase mtROS levels. MDA-MB-231 cells were treated with MOG (4 mM) or MitoPQ (5 μM) for 1 d. mtROS levels were measured and shown. n = 6. (B) mtROS signaling mediates MOG-induced cell proliferation. After MDA-MB-231 cells were treated with MOG (4 mM) and/or MitoQ (1 μM) for 2 d, % of cells in S phase was determined by flow cytometry and expressed as fold changes over the control group. n = 4. (C) Effect of MitoPQ. After MDA-MB-231 cells were treated with MitoPQ (5 μM) for 2 d, % of cells in S phase was determined and expressed as fold change over the control group. n = 7. (D and E) SGK1 mediates MOG- and MitoPQ-induced cell proliferation. MDA-MB-231 cells were treated with MOG (4 mM), MitoPQ (5 μM), and/or GSK650394 (20 μM) for 2 d. % of cells in S phase was determined and expressed as fold change over the control group. n = 3. (F and G) Knockdown of SGK1 abolishes MOG (F)- and MitoPQ (G)-induced cell proliferation. MDA-MB-231 cells were transfected with the control (NC-siRNA) or SGK1-siRNA. One day after transfection, MOG (4 mM) or MitoPQ (5 μM) was added. % of cells in S phase was determined 2 d later and expressed as fold change over the control group. n = 6. (H and I) Inhibition of SGK1 reduces oxygen consumption rate (OCR). MDA-MB-231 cells were treated with MOG and/or GSK650394 (20 μM) for 4 h and subjected to seahorse assays. Oligomycin, FCCP, and rotenone/AA were spiked into cells at various timepoints, and OCR was measured. Calculated parameters are shown in I. n = 8. Similar results were obtained in a separate experiment. (J and K) F1Fo-ATP synthase activity is required in MOG (J)- and ROS (K)-induced cell proliferation. After MDA-MB-231 cells were treated with MOG (4 mM), MitoPQ (5 μM), and/or oligomycin (5 μM) for 2 d, % of cells in S phase was determined and expressed as fold change over the control group. n = 6. Data are shown as mean ± SEM. ns, not significant. *, **, ***, and **** indicate P < 0.05, 0.01, 0.001, and 0.0001, respectively. |