
|
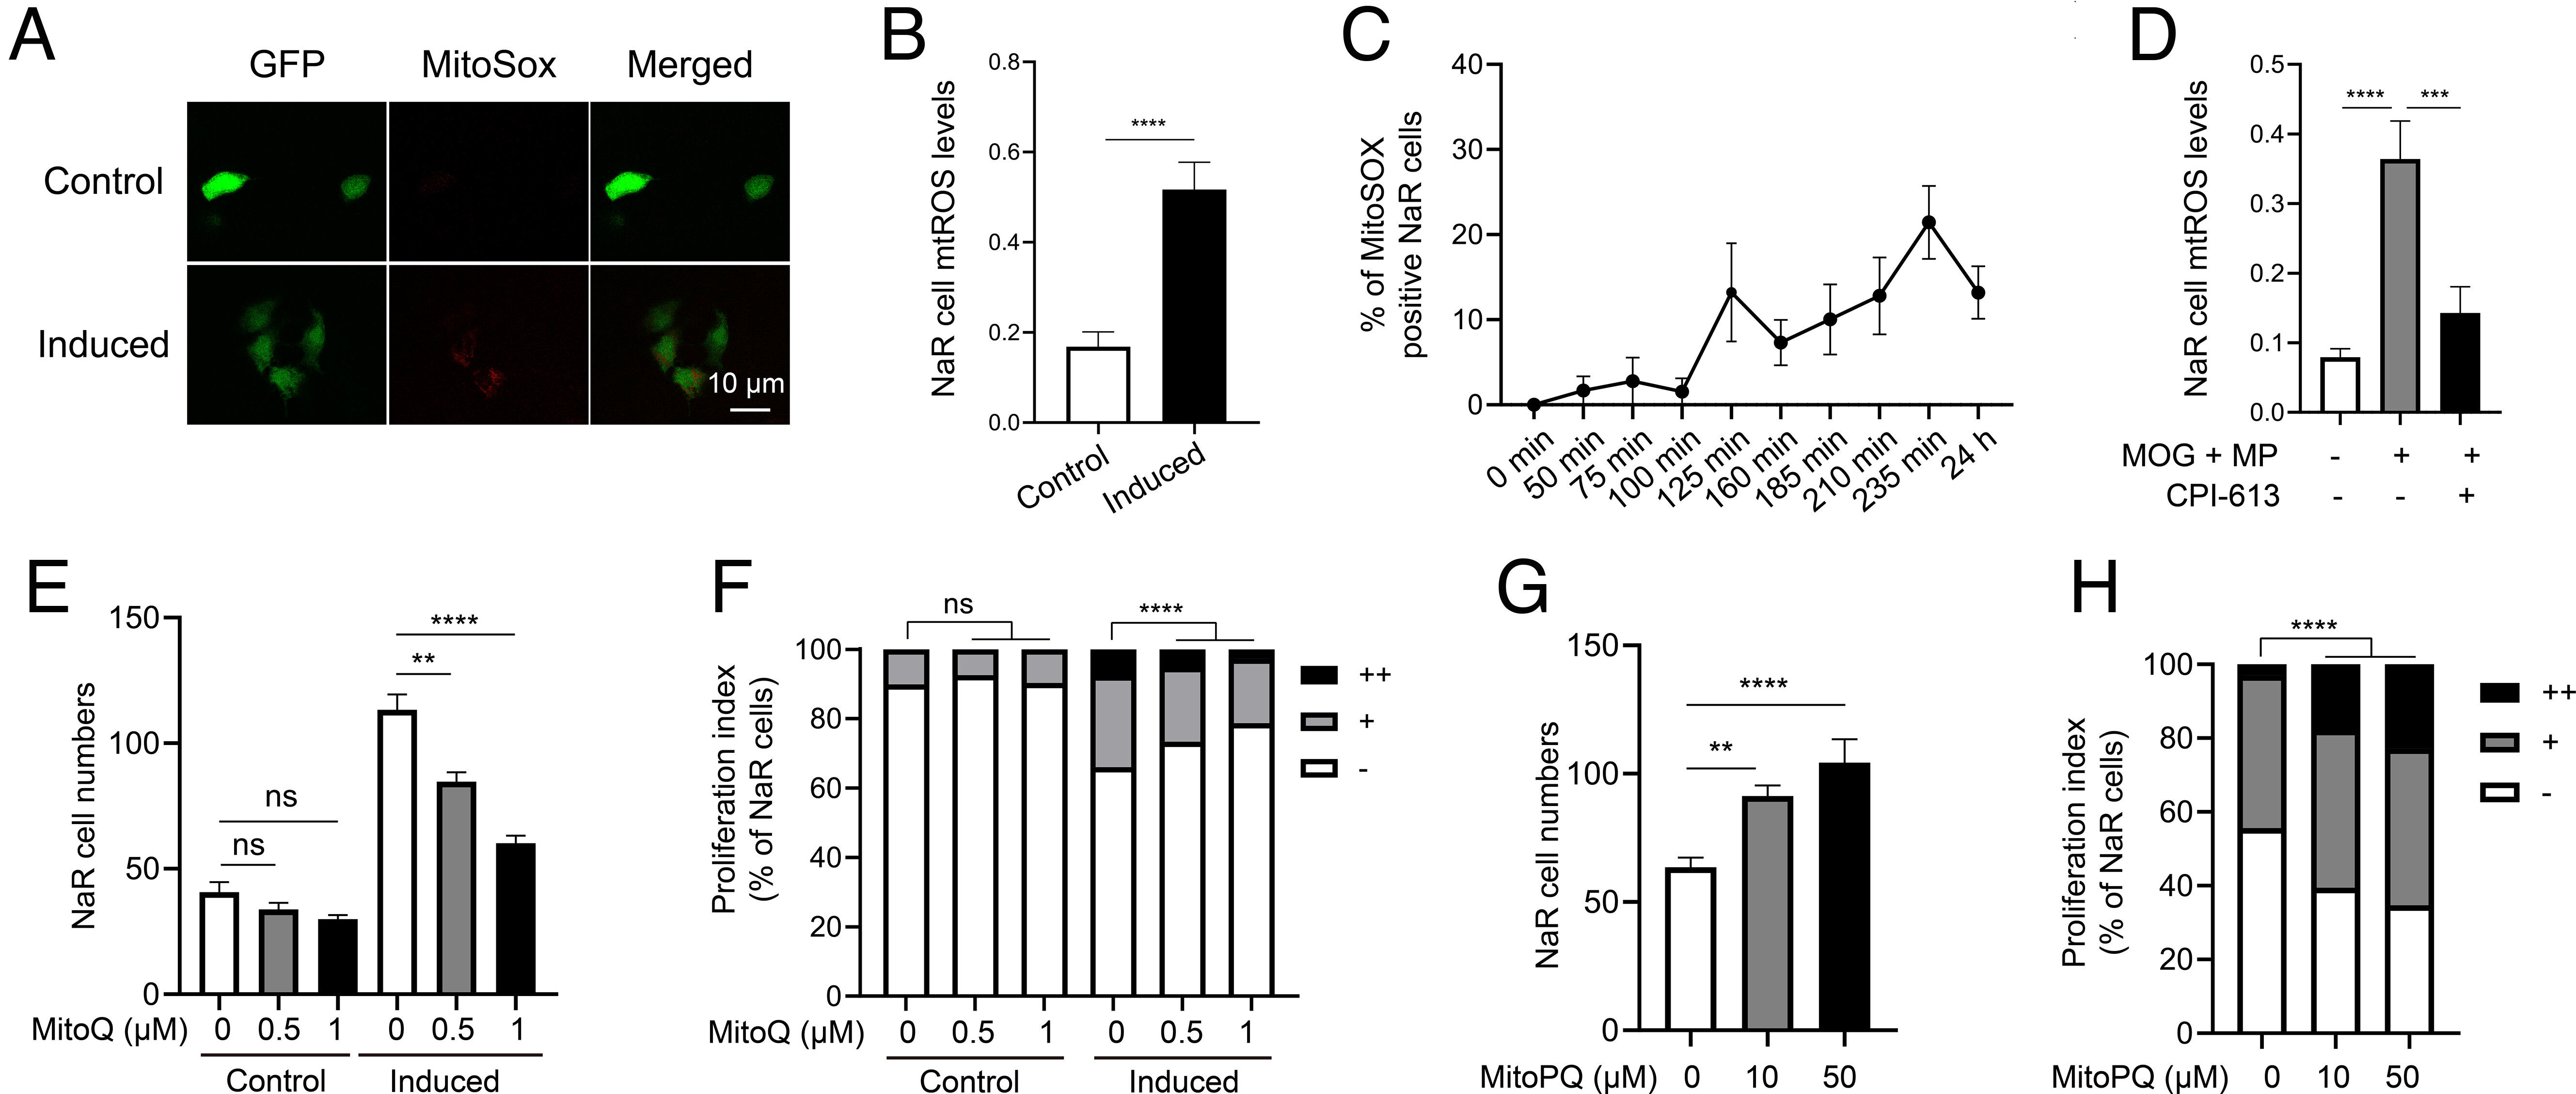
Fig. 4 ROS signaling promotes NaR cell reactivation. (A and B) Mitochondrial reactive oxygen species (mtROS) levels. Tg(igfbp5a:GFP) larvae were transferred to the control or induction medium at 3 dpf. One day later, NaR cell mtROS levels were measured. Representative images are shown in A and quantified results in B. n = 201 to 390 cells from multiple fish. (C) Time course changes. Tg(igfbp5a:GFP) larvae (3 dpf) were transferred to the induction medium. A subset of larvae were randomly sampled at the indicated time point and % of MitoSOX-positive NaR cells was determined and shown. n = 4 fish/group. (D) Effects of MOG+MP and CPI-613. Tg(igfbp5a:GFP) larvae (3 dpf) were transferred to the control or induction medium with or without 100 μM MOG + MP and 3 μM CPI-613. One day later, NaR cell mtROS levels were measured and shown. n= 197 to 276 cells from multiple fish. (E and F) mtROS signaling is required. Tg(igfbp5a:GFP) larvae were transferred to the control or induction medium containing the indicated dose of MitoQ at 3 dpf. Two days later, NaR cell number (E) and proliferation index (F) were measured and shown. n = 15 to 42 fish/group. (G and H) ROS signaling is sufficient. Tg(igfbp5a:GFP) larvae were raised in the control medium containing the indicated concentrations of MitoPQ from 3 to 5 dpf. NaR cell number (G) and proliferation index (H) were measured and shown. n = 15 to 42 fish/group. The proliferation index results are shown as % of total NaR cells counted. All other data are shown as mean ± SEM. ns, not significant. *, **, ***, and **** indicate P < 0.05, 0.01, 0.001, and 0.0001, respectively.