
Fig. 2
- ID
- ZDB-FIG-231103-61
- Publication
- Li et al., 2023 - ROS signaling-induced mitochondrial Sgk1 expression regulates epithelial cell renewal
- Other Figures
- All Figure Page
- Back to All Figure Page
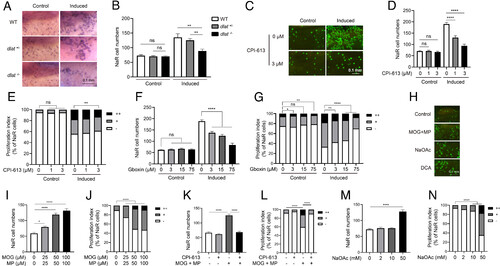
Elevated mitochondrial metabolism is required and sufficient to reactivate NaR cells. (A and B) Genetic disruption of the PDH complex impairs NaR cell reactivation. The progenies of dlat+/− intercrosses were transferred to the control or induction medium at 3 dpf. Two days later, NaR cells were labeled by in situ hybridization and quantified. Fish were genotyped individually afterward. Representative images are shown in A and NaR cell number in B. n = 13 to 40 fish/group. (C–E) Effect of CPI-613. Tg(igfbp5a:GFP) larvae (3 dpf) were transferred to the control or induction medium containing the indicated doses of CPI-613. Two days later, NaR cell number (D) and proliferation index (E) were measured and shown. Representative images are shown in C. n = 25 to 31 fish/group. (F and G) Effect of Gboxin. Tg(igfbp5a:GFP) embryos were raised and treated as described in C with the indicated doses of Gboxin. NaR cell number (F) and proliferation index (G) were measured and shown. n = 24 to 33 fish/group. (H–N) Effects of dimethyl 2-oxoglutarate (MOG)+methyl pyruvate (MP), sodium acetate (NaOAc), and CPI-613 (3 μM). Tg(igfbp5a:GFP) larvae were transferred to the control medium containing the indicated chemicals at 3 dpf. Two days later, NaR cell number (I, K, and M) and proliferation index (J, L, and N) were measured and shown. n = 15 to 31 fish/group. Representative images are shown in H. The proliferation index results are shown as % of total NaR cells counted. All other data are shown as mean ± SEM. ns, not significant. *, **, ***, and **** indicate P < 0.05, 0.01, 0.001, and 0.0001, respectively. |