
|
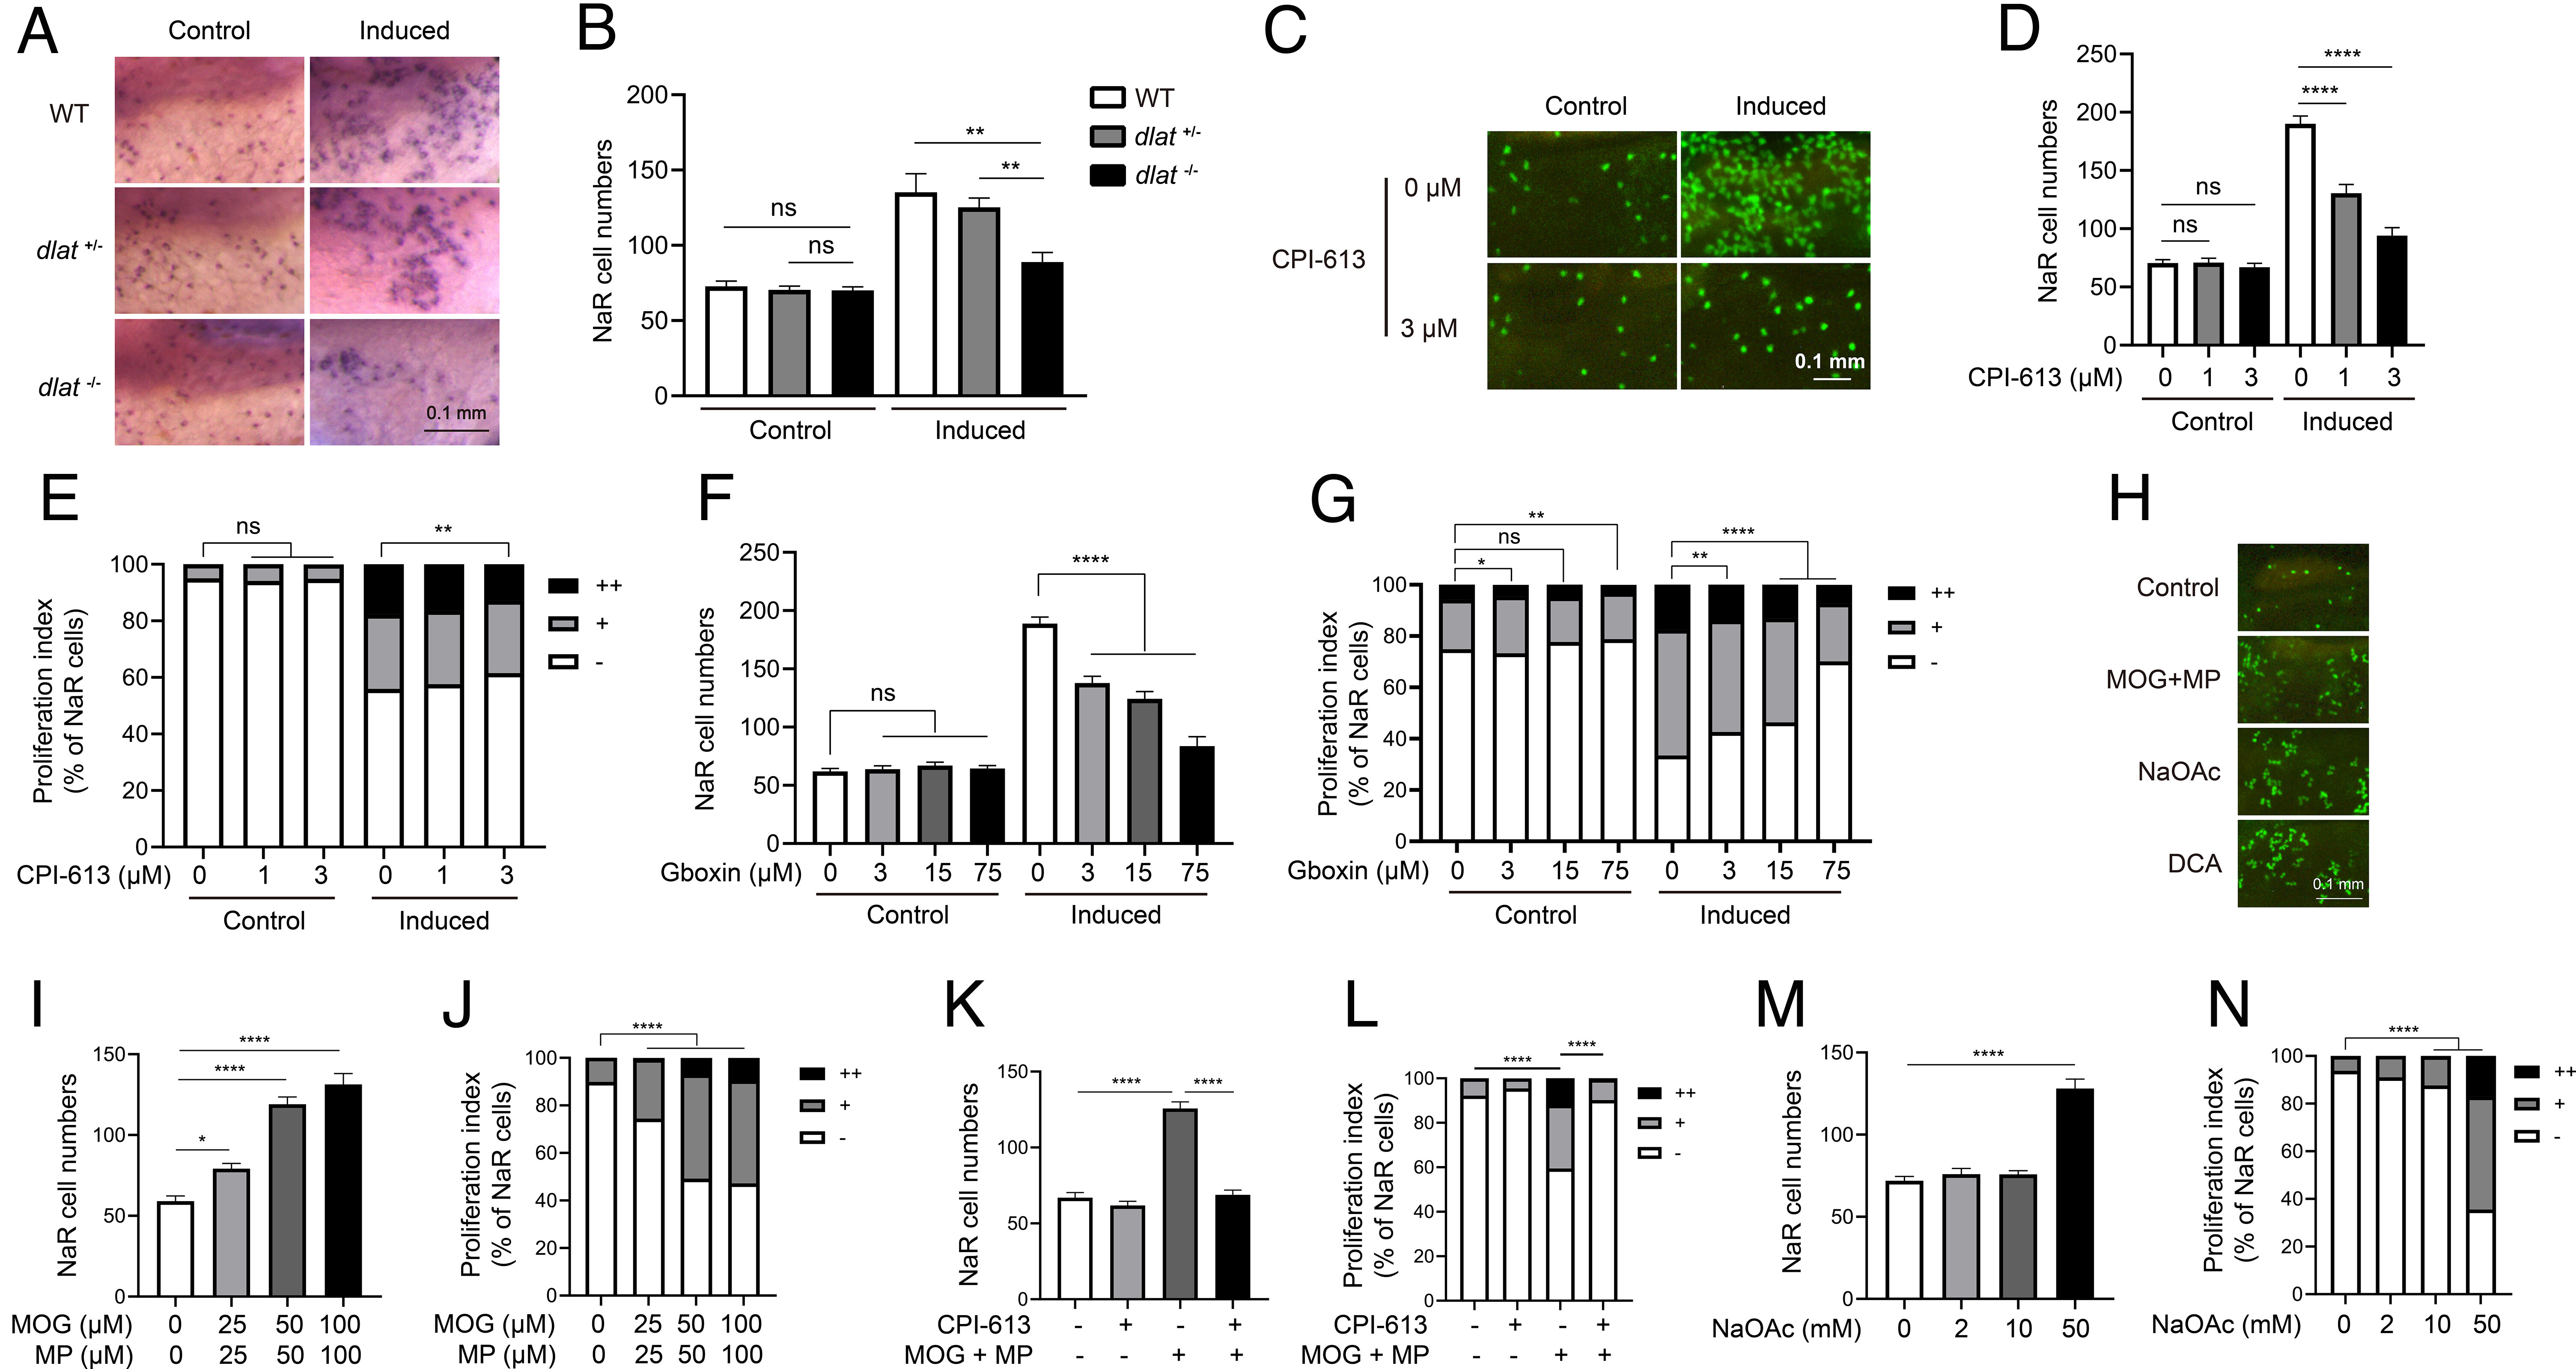
Fig. 2 Elevated mitochondrial metabolism is required and sufficient to reactivate NaR cells. (A and B) Genetic disruption of the PDH complex impairs NaR cell reactivation. The progenies of dlat+/− intercrosses were transferred to the control or induction medium at 3 dpf. Two days later, NaR cells were labeled by in situ hybridization and quantified. Fish were genotyped individually afterward. Representative images are shown in A and NaR cell number in B. n = 13 to 40 fish/group. (C–E) Effect of CPI-613. Tg(igfbp5a:GFP) larvae (3 dpf) were transferred to the control or induction medium containing the indicated doses of CPI-613. Two days later, NaR cell number (D) and proliferation index (E) were measured and shown. Representative images are shown in C. n = 25 to 31 fish/group. (F and G) Effect of Gboxin. Tg(igfbp5a:GFP) embryos were raised and treated as described in C with the indicated doses of Gboxin. NaR cell number (F) and proliferation index (G) were measured and shown. n = 24 to 33 fish/group. (H–N) Effects of dimethyl 2-oxoglutarate (MOG)+methyl pyruvate (MP), sodium acetate (NaOAc), and CPI-613 (3 μM). Tg(igfbp5a:GFP) larvae were transferred to the control medium containing the indicated chemicals at 3 dpf. Two days later, NaR cell number (I, K, and M) and proliferation index (J, L, and N) were measured and shown. n = 15 to 31 fish/group. Representative images are shown in H. The proliferation index results are shown as % of total NaR cells counted. All other data are shown as mean ± SEM. ns, not significant. *, **, ***, and **** indicate P < 0.05, 0.01, 0.001, and 0.0001, respectively.