
|
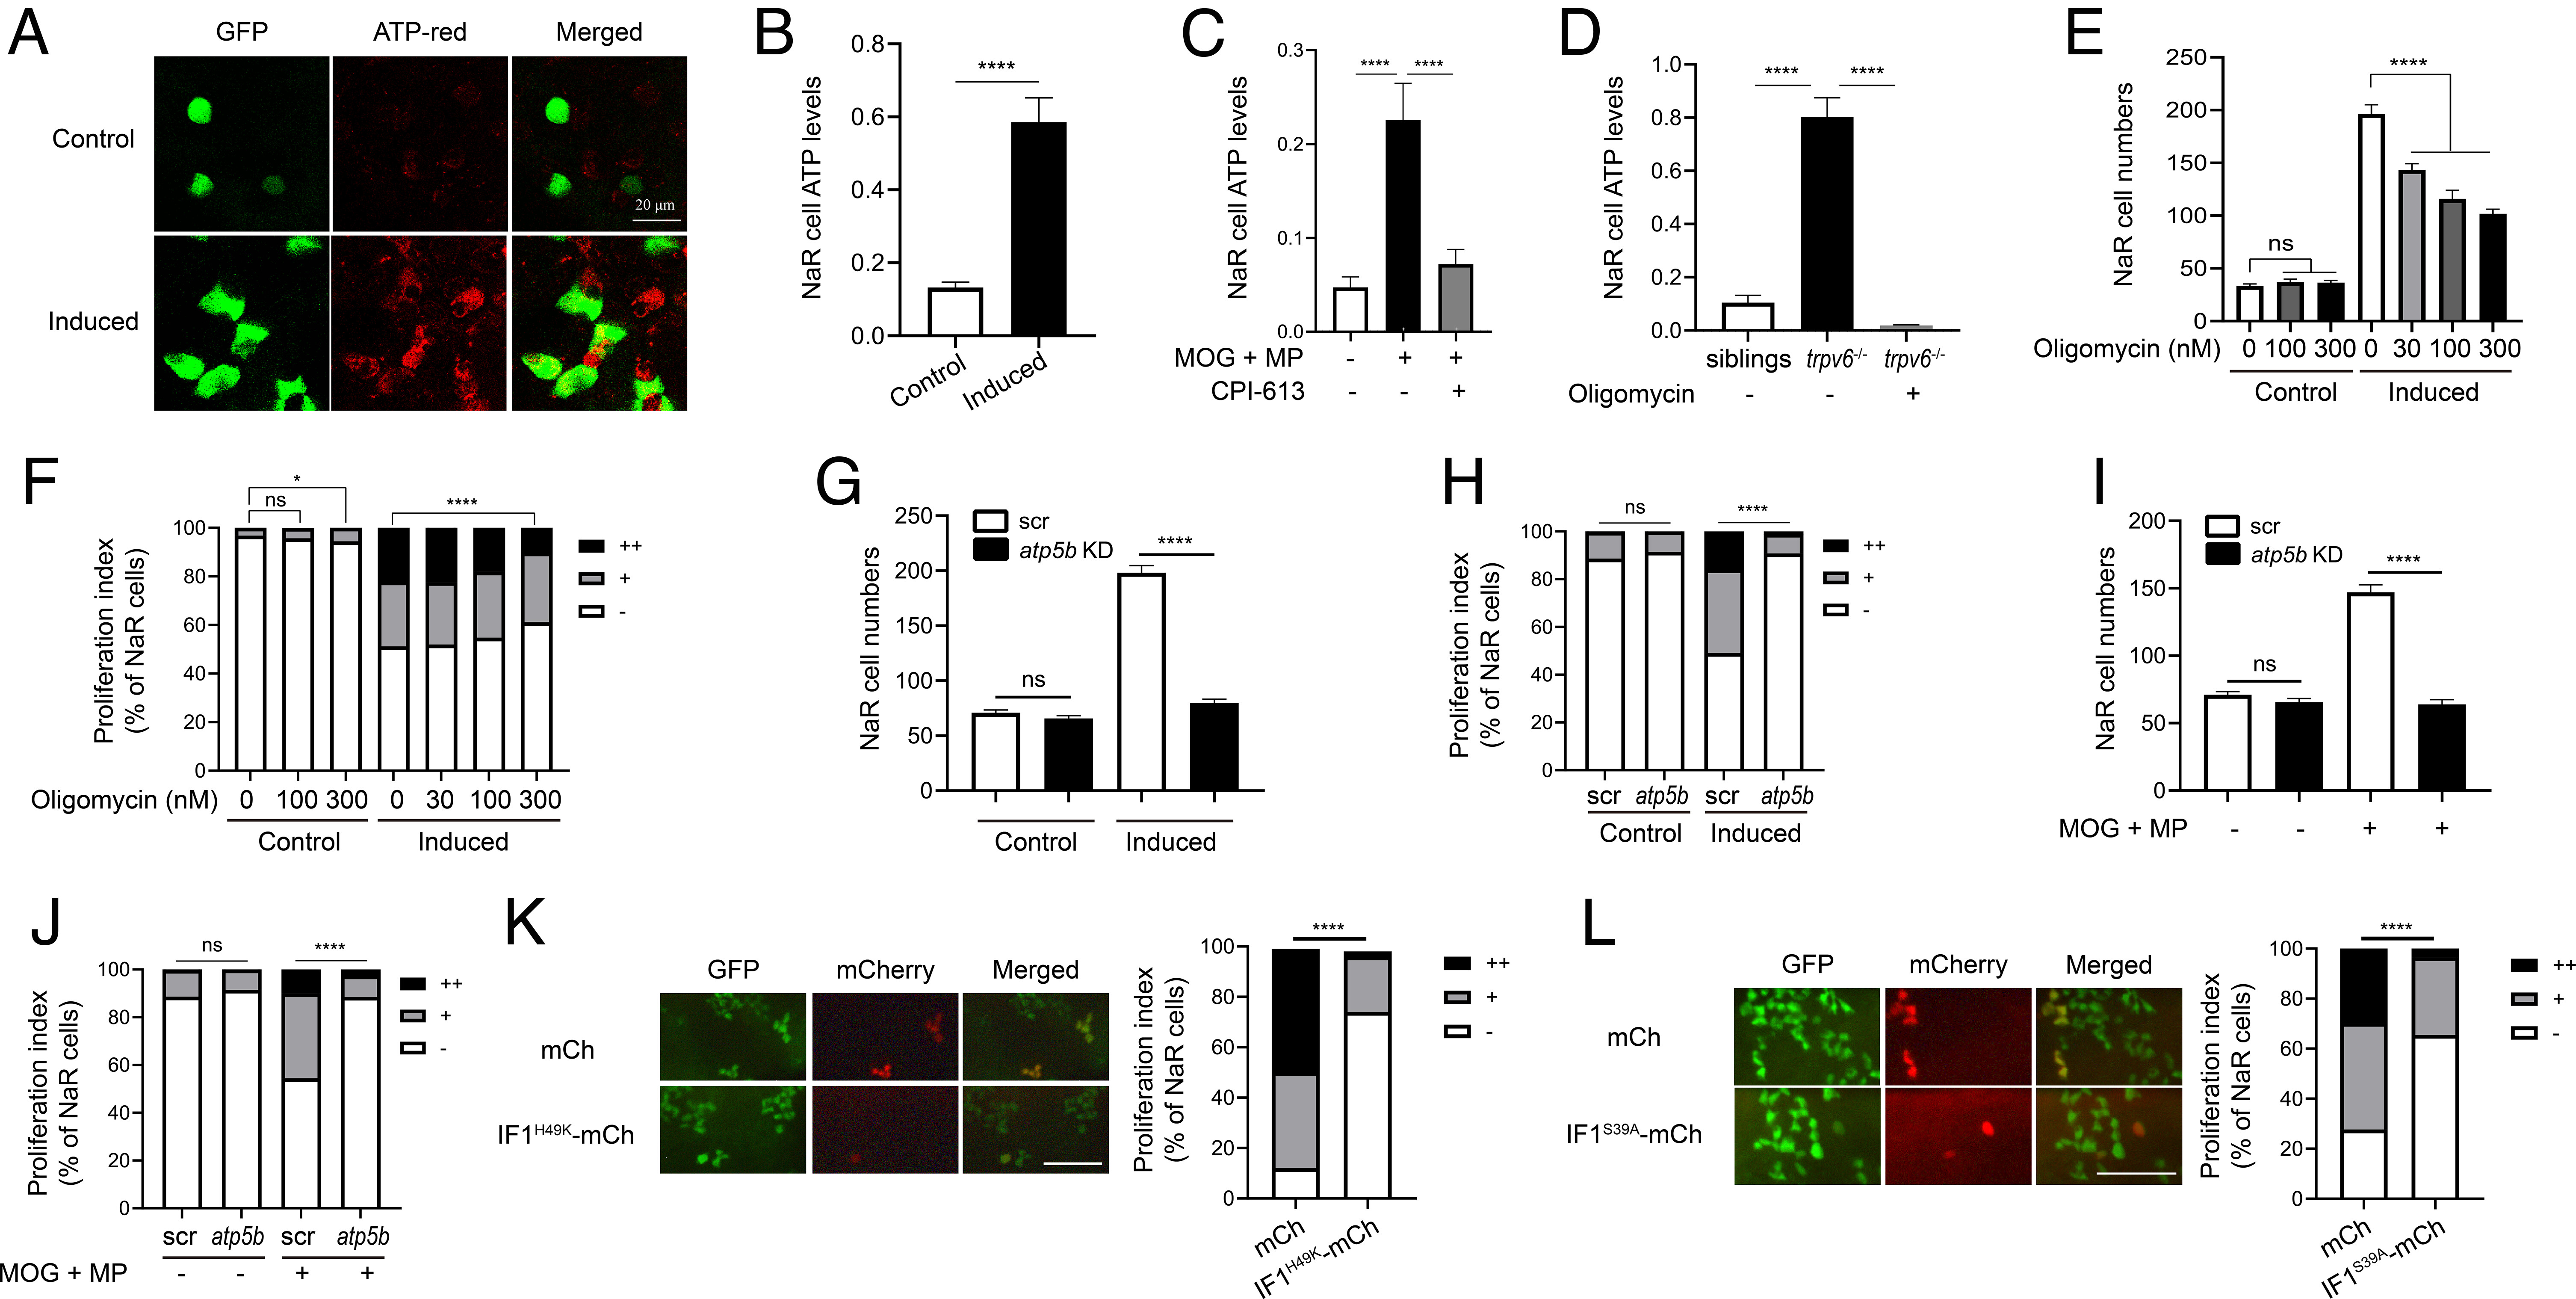
Fig. 3 NaR cell reactivation requires ATP synthesis. (A and B) ATP levels. Tg(igfbp5a:GFP) larvae (3 dpf) were transferred to the control or induction medium. After 18 h, NaR cell mitochondrial ATP levels were measured. Representative images are shown in A and quantified results in B. n = 205 to 447 cells from multiple fish. (C) Effects of MOG + MP and CPI-613. Tg(igfbp5a:GFP) fish (3 dpf) were transferred to the control medium containing DMSO, 100 μM MOG + 100 μM MP, and/or 3 μM CPI-613. Five hours later, NaR cell mitochondrial ATP levels were measured and shown. n = 157 to 233 cells from multiple fish. (D) Elevated mitochondrial ATP levels in trpv6−/− NaR cells. Progeny from trpv6+/−; Tg(igfbp5a:GFP) intercrosses were raised to 3 dpf. They were transferred to the control medium with or without 200 nM oligomycin. After measuring NaR cell mitochondrial ATP levels, the genotype of each fish was determined. n = 112 to 315 cells from multiple fish. (E and F) Effect of oligomycin. Tg(igfbp5a:GFP) fish (3 dpf) were transferred to the control or induction medium containing oligomycin at the indicated concentrations. Two days later, NaR cell number (E) and proliferation index (F) were measured and shown. n = 12 to 34 fish/group. (G−J) CRISPR-Cas9-mediated atp5b deletion. Tg(igfbp5a:GFP) embryos injected with targeting gRNAs and Cas9 mRNA were raised to 3 dpf and transferred to the control or induction medium without (G and H) or with 100 μM MOG + 100 μM MP (I and J). Two days later, NaR cell number (G and I) and proliferation index (H and J) were measured and shown. n = 14 to 42 fish/group. (K and L) NaR cell–specific expression of IF1H49K (K) or IF1S39A (L). Tg(igfbp5a:GFP) embryos injected with BAC-mCherry, BAC-IF1H49K, or BAC- IF1S39A-mCherry DNA were raised to 3 dpf and transferred to the induction medium. Two days later, NaR cells expressing the transgene were identified, and cell proliferation index was measured. Representative images are shown in the left panel and quantified data in the right. Scale bar represents 0.1 mm. n = 102 to 163 in K and n = 29 to 148 cells from multiple fish in L. The proliferation index data are shown as % of total NaR cells counted. All other data are shown as mean ± SEM. ns, not significant. *, **, ***, and **** indicate P < 0.05, 0.01, 0.001, and 0.0001, respectively.