
|
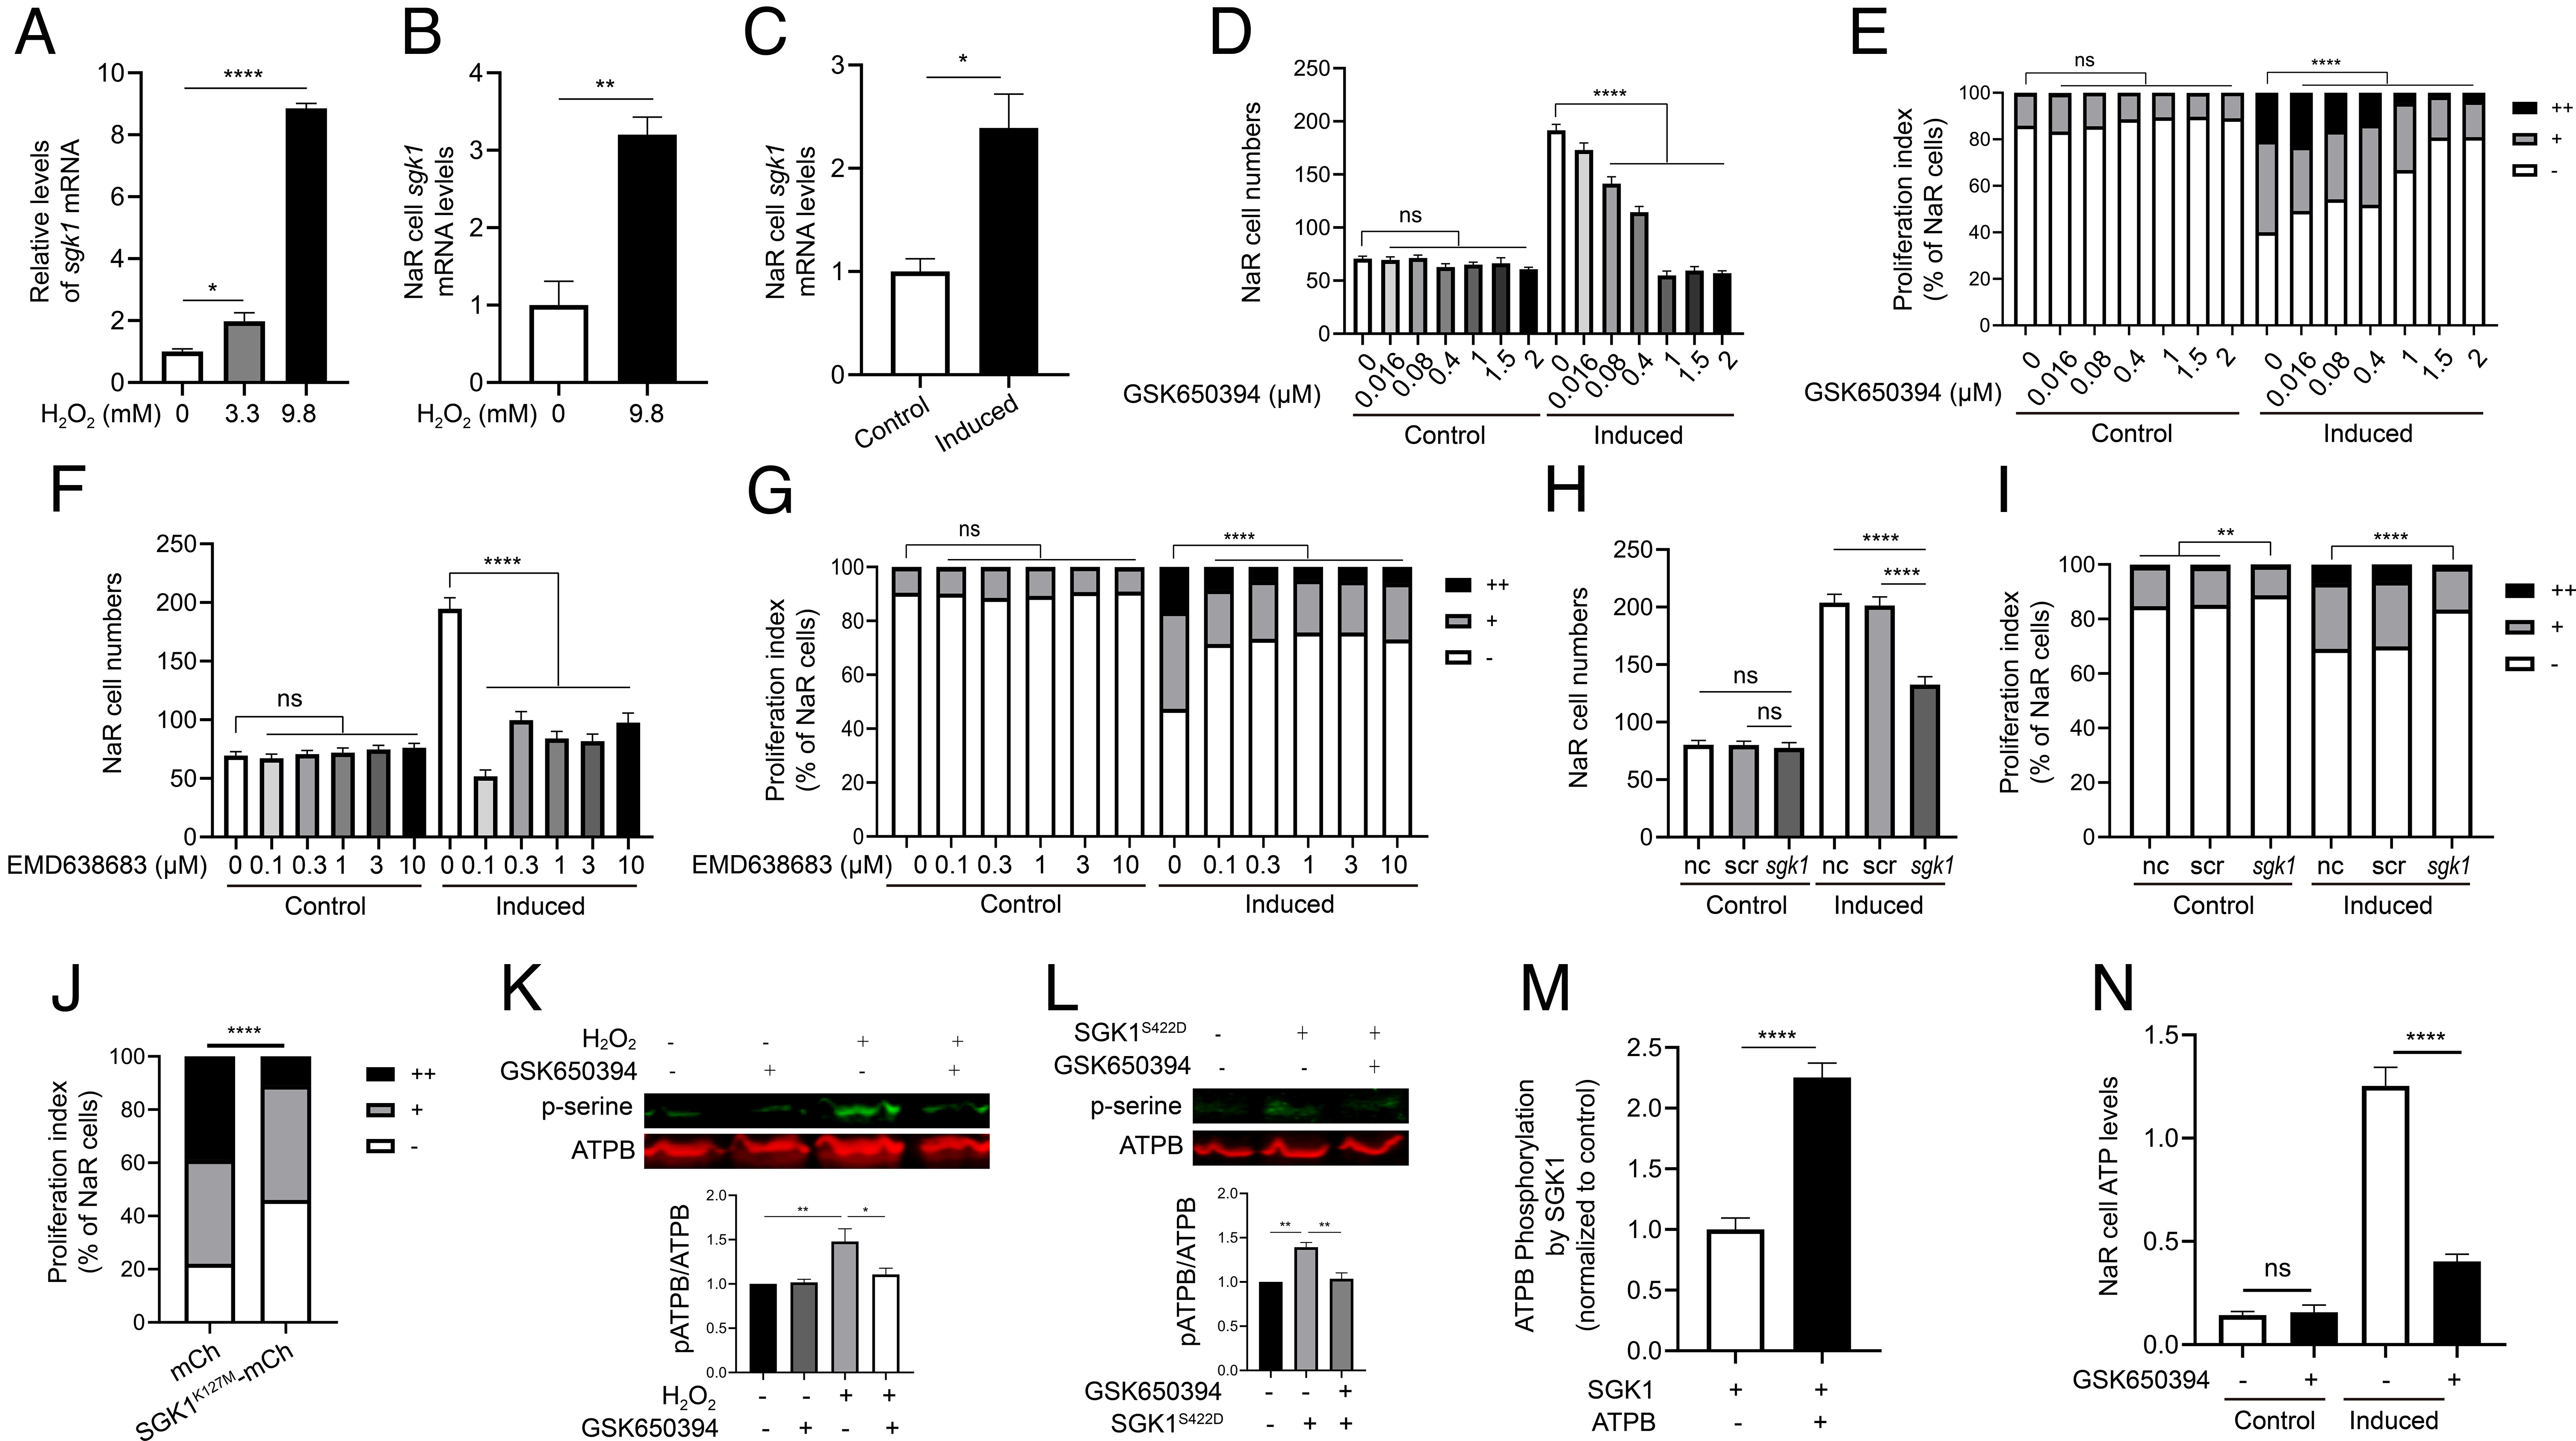
Fig. 5 ROS signaling–induced Sgk1 mitochondrial expression is critical. (A) Induction of sgk1 expression by H2O2. Zebrafish larvae (3 dpf) were transferred to the control medium containing the indicated doses of H2O2. After 3 h, the larvae were collected and sgk1 mRNA levels measured. n = 4. (B) Expression and ROS induction of sgk1 mRNA in NaR cells. Tg(igfbp5a:GFP) larvae were treated with H2O2 at the indicated dose for 3 h. NaR cells were isolated by FACS sorting and analyzed by qRT-PCR. n = 3. (C) Increased sgk1 mRNA levels in reactivated NaR cells. NaR cells were isolated by FACS sorting from Tg(igfbp5a:GFP) larvae treated with the control or induction medium for 18 h. sgk1 mRNA levels were measured and shown. n = 4. (D–G) Effects of SGK1 inhibitors. Tg(igfbp5a:GFP) embryos (3 dpf) were transferred to the control or induction medium containing the indicated doses of GSK-650394 (D and E) or EMD638683 (F and G). Two days later, NaR cell number (D and F) and proliferation index (E and G) were determined as described in Fig. 1 and shown. n = 15 to 41 fish/group. (H and I) CRISPR/Cas9-mediated sgk1 deletion. Tg(igfbp5a:GFP) embryos were injected with sgk1 targeting gRNAs and Cas9 mRNA at the one-cell stage. They were raised to 3 dpf and transferred to the control or induction medium. Two days later, NaR cell number (H) and proliferation index (I) were measured and shown. n = 30 to 58 fish/group. (J) Effect of SGK1K127M expression in NaR cells. Tg(igfbp5a:GFP) embryos were injected with the indicated BAC-mCherry DNA at the one-cell stage. They were raised to 3 dpf and transferred to the induction medium. Two days later, cell proliferation index in mCherry-expressing NaR cells was determined and shown. n = 45 to 211 from multiple fish. (K) HEK293 cells were treated with DMSO or GSK650394 overnight, followed by 2-h H2O2 treatment (250 μM H2O2). Cells were subjected to IP using an anti-ATP5B antibody. The IP samples were analyzed by western blot using the indicated antibodies. Representative results are shown in the top panel. Ratio of phospho- and total ATP5B is shown at the bottom. n = 4. (L) HEK293 cells were transfected with Sgk1S422D-mcherry or an empty vector, followed by GSK650394 treatment. Cells were analyzed and shown as described in K. n = 3. (M) SGK1 phosphorylates ATP5B. n = 5. Human SGK1 was incubated with or without ATP5B, and changes in ATP5B phosphorylation were measured. (N) Elevated mitochondrial ATP synthesis in reactivated NaR cells is Sgk1 dependent. Tg(igfbp5a:GFP) larvae (3 dpf) were transferred to the control or induction medium for 14 h. They were then treated with DMSO or GSK650394 for 4 h. ATP levels were analyzed and shown. n = 178 to 609 cells from multiple fish. The proliferation index results are shown as % of total NaR cells counted. All other data are shown as mean ± SEM. ns, not significant. *, **, ***, and **** indicate P < 0.05, 0.01, 0.001, and 0.0001, respectively.