
Fig. 1
- ID
- ZDB-FIG-231103-60
- Publication
- Li et al., 2023 - ROS signaling-induced mitochondrial Sgk1 expression regulates epithelial cell renewal
- Other Figures
- All Figure Page
- Back to All Figure Page
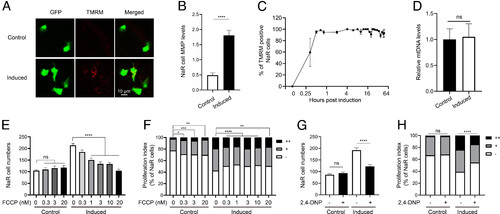
Elevated mitochondrial membrane potential (MMP) promotes NaR cell reactivation. (A and B) MMP levels in the control and reactivated NaR cells. Tg(igfbp5a:GFP) larvae (3 dpf) were transferred to the control or induction medium. Two days later, MMP levels in NaR cells were measured after TMRM staining and normalized by GFP signal. Representative images are shown in A and quantified results in B. n = 221 to 447 cells from multiple fish. (C) Time course of MMP change. Tg(igfbp5a:GFP) larvae (3 dpf) were transferred to the induction medium. A subset of larvae were randomly sampled at the indicated time point and % of TMRM-positive NaR cells was measured and shown. n = 2 to 6 fish/time point. (D) Mitochondrial DNA levels. NaR cells were isolated by FACS from fish described in A and B. The levels of mitochondrial 16S rRNA gene were measured and normalized by the levels of nuclear aryl hydrocarbon receptor 2 gene. n = 4. (E−H) Tg(igfbp5a:GFP) larvae (3 dpf) were transferred to the control or induction medium containing the indicated concentration of FCCP. (E and F) or 1 μM 2,4-DNP. (G and H). Two days later, NaR cell number (E and G) and NaR cell proliferation index (F and H) were determined and shown. n = 11 to 26 fish/group. The cell proliferation index was determined by counting NaR cells that divided 0, 1, or 2 times (denoted by −, +, and ++, respectively) over the course of the experiment and presented as % of total NaR cells. All other data are shown as mean ± SEM. ns, not significant. *, **, ***, and **** indicate P < 0.05, 0.01, 0.001, and 0.0001, respectively. |