FIGURE SUMMARY
Title

Actionable cancer vulnerability due to translational arrest, p53 aggregation and ribosome biogenesis stress evoked by the disulfiram metabolite CuET

Authors
Kanellis, D.C., Zisi, A., Skrott, Z., Lemmens, B., Espinoza, J.A., Kosar, M., Björkman, A., Li, X., Arampatzis, S., Bartkova, J., Andújar-Sánchez, M., Fernandez-Capetillo, O., Mistrik, M., Lindström, M.S., Bartek, J.
Source
Full text @ Cell Death Differ.

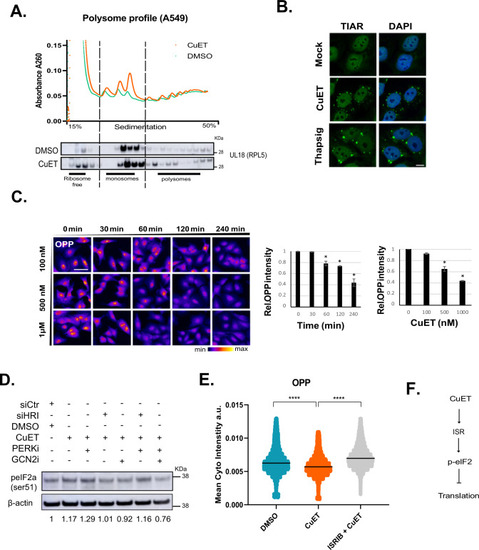
CuET rapidly blocks protein synthesis.

A Upper panel: Polysome profiling of A549 epithelial cells following treatment with CuET for 1 h, lower panel: immunoblotting of the ribosomal protein RPL5 (uL18) in polysome profile fractions of A549 under the same experimental conditions. B Representative IF images of TIAR-containing stress granules after CuET treatment of A549 cells. The UPR inductor thapsigargin was used as a positive control. scale bar = 10 μm. C O-propargyl-puromycin (OPP) incorporation followed by high-content microscopy for the quantitation of translation rates in A549 cells treated with CuET or DMSO. 750–1500 cells were analyzed per experiment (data are shown as mean ± SD, n = 3 biological replicates, *p < 0.05) scale bar: 50 µm. D Immunoblotting of phosphorylated eIF2a (ser51) following treatment of A549 with CuET (2 h) +/–PERK inhibitor combined with siRNA against HRI or chemical inhibition of GCN2. Numbers below the blot indicate the signal ratio p-eIF2a/β-actin. E OPP incorporation followed by high-content microscopy for the quantitation of translation rates in A549 cells treated with CuET (2 h) +/− the ISR inhibitor ISRIB. 1000–2000 cells were analyzed per experiment (data shown as mean ± SD, n = 3 biological replicates, ****p < 0.001). F Schematic model connecting CuET treatment and translation.

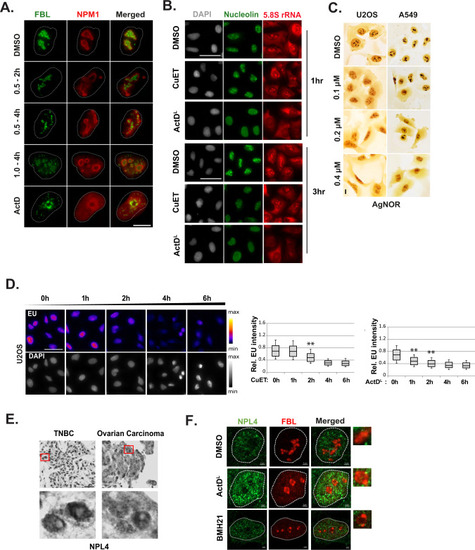
CuET alters the nucleolar morphology.

A Representative IF images of A549 nuclei treated with CuET or ActDL for the indicated time points. Fibrillarin (FBL) or nucleophosmin (NPM1) were used as nucleolar markers. Scale bar: 5 μM. B Representative IF images of nucleolin and 5.8S rRNA levels in A549 cells treated with CuET or ActDL for the indicated time points. Scale bar: 50 µm. C AgNOR staining of U2OS or A549 cells following a four-hour treatment of increasing CuET doses. Scale bar: 10 μm. D Ethylene uridine (EU) levels were calculated following IF and high content imaging of U2OS treated with 1 μM CuET for the indicated time points. 750–1500 cells were analyzed per experiment (data are shown as mean ± SD, n = 3 biological replicates, **p < 0.01). Scale bar: 50 µm. E Detection of NPL4 protein levels with immunocytochemistry in samples from patients with triple-negative breast cancer (TNBC) or ovarian carcinoma. Regions in red squares are presented magnified in the bottom panel. Scale bar: 100 μM. F Representative IF images of nucleolar structure in U2OS treated with ActDL or BMH-21 as nucleolar stress inducers. Fibrillarin (FBL) was used as a nucleolar marker. Insets depict magnifications of the regions designated in squares. Scale bar: 2 μM.

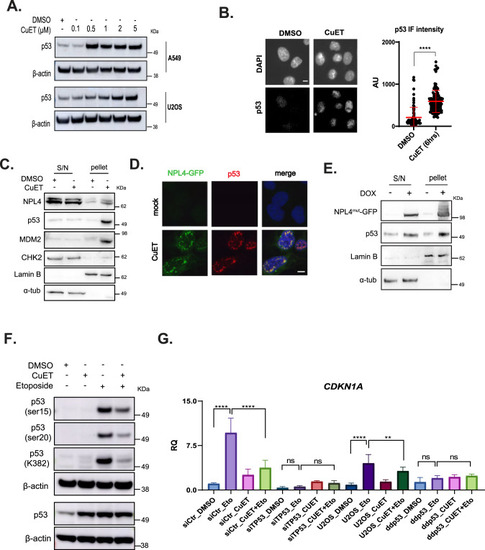
CuET triggers p53 entrapment in NPL4-rich aggregates.

A Immunoblotting of p53 protein levels following increasing concentrations of CuET in U2OS or A549 cells. B IF-based quantitation of p53 levels following CuET treatment of A549 cells. Data are shown as mean ± SD, n = 3 biological replicates, ****p < 0.001. Scale bar: 10 μM. C NPL4, p53, MDM2, and CHK2 protein levels following CuET treatment and fractionation of A549 cells. Lamin B and α-tubulin were used as markers for the soluble (S/N) and insoluble (pellet) fractions, respectively. D Representative IF images of GFP-tagged NPL4 and p53 protein levels following treatment of NPL4-GFP U2OS cells with CuET. Scale bar: 10 μM. E NPL4 and p53 protein levels in U2OS cells ectopically expressing NPL4mut. Lamin B and α-tubulin were used as markers for the soluble (S/N) and insoluble (pellet) fractions, respectively. F Immunoblotting of various p53 post-translational modifications (PTM) in A549 cells treated with CuET+/− (6 h) Etoposide (last 2 h). Etoposide was used as a positive control known to induce activating p53 PTMs. GCDKN1A mRNA levels following treatment with CuET (6 h) +/− Etoposide (last 2 h). Two different cell models were used: A549 transfected with siRNA against TP53 or control siRNA and U2OS cells compared to U2OS cells carrying a dominant negative p53 mutant (ddp53) (data are shown as mean ± SD, n = 3 biological replicates, ****p < 0.001, ***p = 0.01, **p < 0.01, ns non-significant).

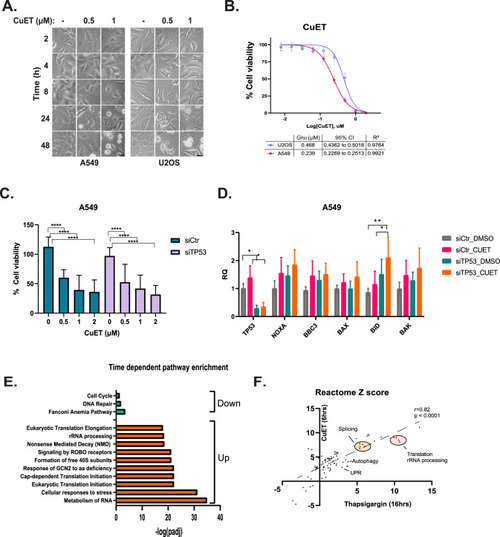
CuET induces cell death in a p53-independent manner.

A. Representative light microscope images following treatment of A549 or U2OS cells with various concentrations of CuET for different time points. Scale bar: 10 μM. B CuET dose-response curves in A549 and U2OS cells. GI50 values are shown in the table with 95% confidence intervals, along with R2 values quantifying the goodness of fit (data are shown as mean ± SD, n = 3 biological replicates). C Cell survival analysis (resazurin) in A549 cells treated with siRNA against TP53 +/− various concentrations of CuET for 24 h. D Quantitative RT-PCR of various p53 targets in A549 cells treated with CuET (6 h) +/− siRNA against TP53 (data are shown as mean ± SD, n = 3 biological replicates, **p < 0.01, *p < 0.05, non-significant values are not shown). E Barplot of pathway enrichment terms (Reactome) for genes that are monotonically up-or down-regulated following CuET treatment. F Scatterplot depicting the correlation of Reactome terms among DE genes affected by CuET or thapsigargin.

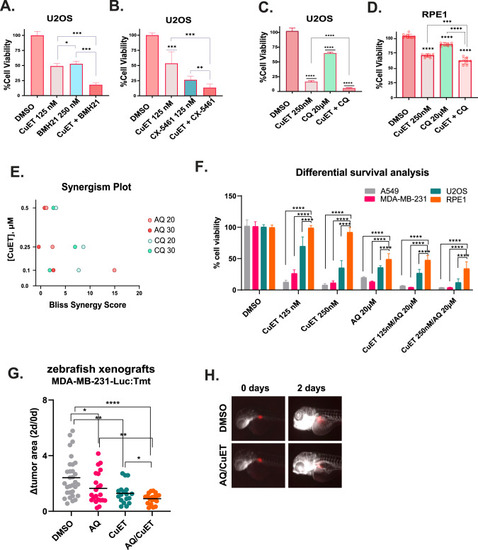
RiBi and autophagy inhibition potentiate the cytotoxic effect of CuET.

A Survival analysis of U2OS cells treated with the synergistic pairs of CuET, BMH-21, or their combination (data are shown as mean ± SD, n = 3 biological replicates, ***p = 0.01, *p < 0.05). B Survival analysis of U2OS cells treated with the synergistic pairs of CuET, CX-5461, or their combination (data are shown as mean ± SD, n = 3 biological replicates, ***p = 0.01,**p < 0.01). CD Survival analysis of U2OS (C) or RPE1 (D) cells treated with the synergistic pairs of CuET, chloroquine (CQ), or their combination (data are shown as mean ± SD, n = 3 biological replicates, ****p < 0.001, ***p = 0.01). E Comparative plot showing the Bliss synergy scores of the dose pairs tested among combinations of CuET/AQ (amodiaquine) and CuET/CQ. F Differential survival analysis between three cancer cell lines (A549, U2OS, MDA-MB-231) and RPE1 treated with CuET+/− AQ (data are shown as mean ± SD, n = 3 biological replicates, ****p < 0.001). G Quantification of the transplanted fluorescent tumor area in zebrafish xenografts treated with DMSO vehicle, AQ, CuET, or their combination for 48 h. The end-point signal (2 days) is normalized to the initial one (0 days) for each sample tested (Δtumor area). H Representative IF images of xenografts treated with DMSO or the combination of AQ/CuET. Tumors composed of transplanted MDA-MB-231 cells are shown in red.

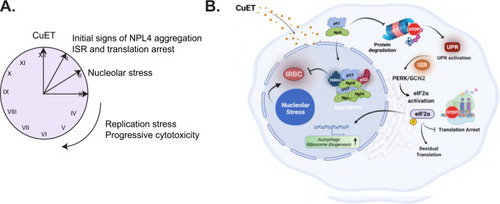
Schematic illustration of the proposed model.

A Schematic presentation of the temporal order for some key cancer cell phenotypes evoked following CuET treatment. B Graphical presentation of the proposed model: the disulfiram metabolite CuET binds NPL4-p97, blocking its role in protein degradation, with ensuing proteotoxic stress and eventually inducing cell death. The NPL4/CuET-nucleated protein aggregates sequester p53 (alongside MDM2) that can no longer be targeted for degradation and thus accumulates, while the p53 activity becomes lower over time, reflecting the progressive aggregate formation and hence p53 sequestration. At the same time, CuET impact activates the cellular ISR and drives the PERK/GCN2a-mediated eIF2a phosphorylation and translational arrest. Cells respond via upregulation of genes affecting, among other mechanisms, RiBi and autophagy, two processes that, when blocked pharmacologically in combination with CuET, show more detrimental effects on cancer cell survival (Figure created with BioRender.com).

Acknowledgments
This image is the copyrighted work of the attributed author or publisher, and ZFIN has permission only to display this image to its users. Additional permissions should be obtained from the applicable author or publisher of the image. Full text @ Cell Death Differ.