IMAGE

Fig. 4

ID
ZDB-IMAGE-230630-61
Source
Figures for Kanellis et al., 2023
Image
Figure Caption

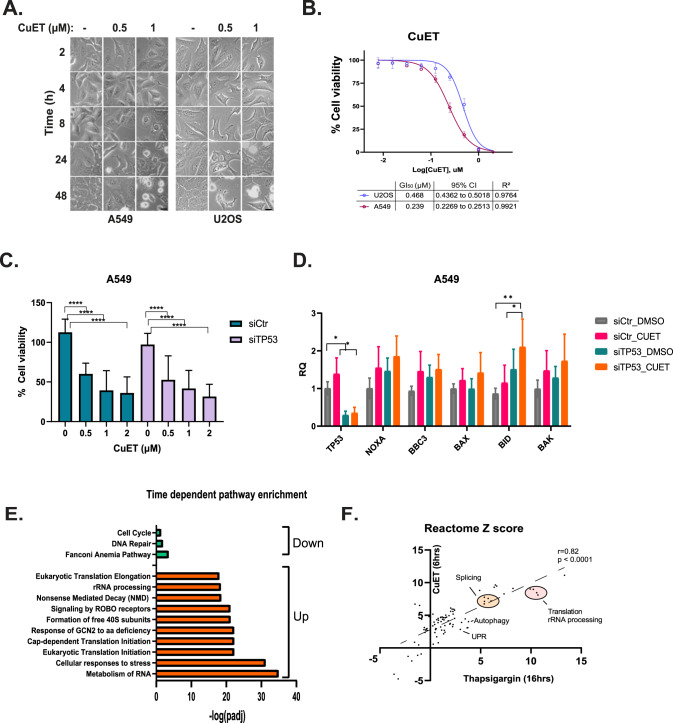
Fig. 4 CuET induces cell death in a p53-independent manner.

A. Representative light microscope images following treatment of A549 or U2OS cells with various concentrations of CuET for different time points. Scale bar: 10 μM. B CuET dose-response curves in A549 and U2OS cells. GI50 values are shown in the table with 95% confidence intervals, along with R2 values quantifying the goodness of fit (data are shown as mean ± SD, n = 3 biological replicates). C Cell survival analysis (resazurin) in A549 cells treated with siRNA against TP53 +/− various concentrations of CuET for 24 h. D Quantitative RT-PCR of various p53 targets in A549 cells treated with CuET (6 h) +/− siRNA against TP53 (data are shown as mean ± SD, n = 3 biological replicates, **p < 0.01, *p < 0.05, non-significant values are not shown). E Barplot of pathway enrichment terms (Reactome) for genes that are monotonically up-or down-regulated following CuET treatment. F Scatterplot depicting the correlation of Reactome terms among DE genes affected by CuET or thapsigargin.

Acknowledgments
This image is the copyrighted work of the attributed author or publisher, and ZFIN has permission only to display this image to its users. Additional permissions should be obtained from the applicable author or publisher of the image. Full text @ Cell Death Differ.