|
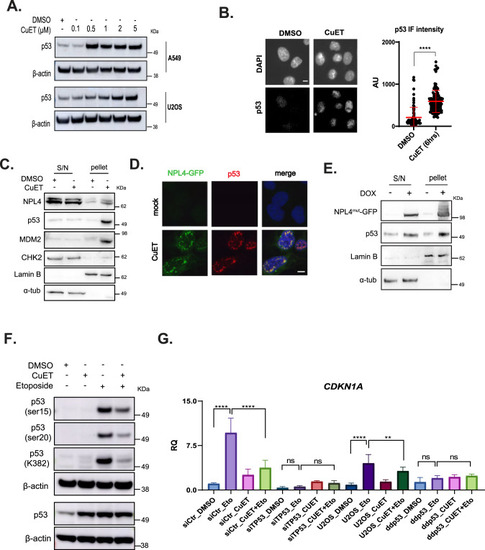
CuET triggers p53 entrapment in NPL4-rich aggregates. A Immunoblotting of p53 protein levels following increasing concentrations of CuET in U2OS or A549 cells. B IF-based quantitation of p53 levels following CuET treatment of A549 cells. Data are shown as mean ± SD, n = 3 biological replicates, ****p < 0.001. Scale bar: 10 μM. C NPL4, p53, MDM2, and CHK2 protein levels following CuET treatment and fractionation of A549 cells. Lamin B and α-tubulin were used as markers for the soluble (S/N) and insoluble (pellet) fractions, respectively. D Representative IF images of GFP-tagged NPL4 and p53 protein levels following treatment of NPL4-GFP U2OS cells with CuET. Scale bar: 10 μM. E NPL4 and p53 protein levels in U2OS cells ectopically expressing NPL4mut. Lamin B and α-tubulin were used as markers for the soluble (S/N) and insoluble (pellet) fractions, respectively. F Immunoblotting of various p53 post-translational modifications (PTM) in A549 cells treated with CuET+/− (6 h) Etoposide (last 2 h). Etoposide was used as a positive control known to induce activating p53 PTMs. GCDKN1A mRNA levels following treatment with CuET (6 h) +/− Etoposide (last 2 h). Two different cell models were used: A549 transfected with siRNA against TP53 or control siRNA and U2OS cells compared to U2OS cells carrying a dominant negative p53 mutant (ddp53) (data are shown as mean ± SD, n = 3 biological replicates, ****p < 0.001, ***p = 0.01, **p < 0.01, ns non-significant).
|