IMAGE

Fig. 3

ID
ZDB-IMAGE-230630-66
Source
Figures for Kanellis et al., 2023
Image
Figure Caption

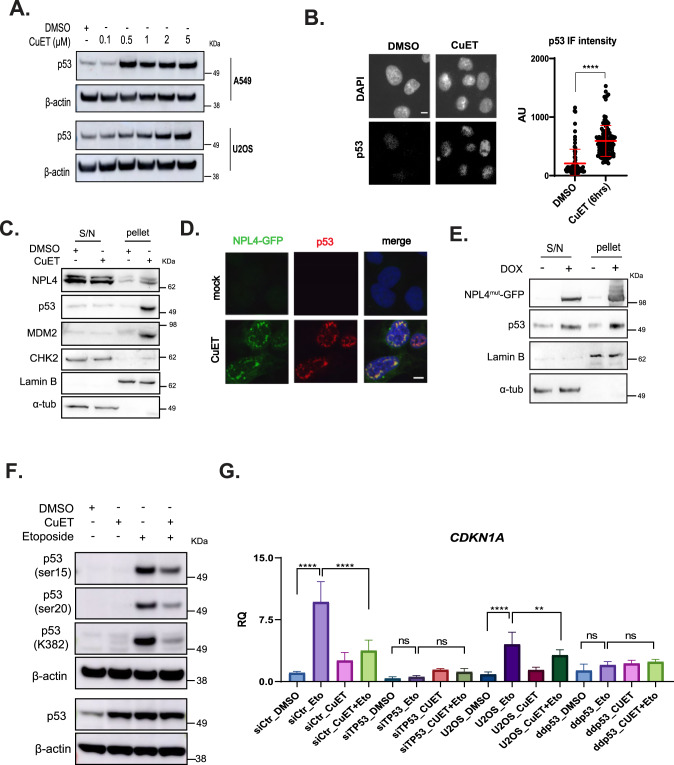
Fig. 3 CuET triggers p53 entrapment in NPL4-rich aggregates.

A Immunoblotting of p53 protein levels following increasing concentrations of CuET in U2OS or A549 cells. B IF-based quantitation of p53 levels following CuET treatment of A549 cells. Data are shown as mean ± SD, n = 3 biological replicates, ****p < 0.001. Scale bar: 10 μM. C NPL4, p53, MDM2, and CHK2 protein levels following CuET treatment and fractionation of A549 cells. Lamin B and α-tubulin were used as markers for the soluble (S/N) and insoluble (pellet) fractions, respectively. D Representative IF images of GFP-tagged NPL4 and p53 protein levels following treatment of NPL4-GFP U2OS cells with CuET. Scale bar: 10 μM. E NPL4 and p53 protein levels in U2OS cells ectopically expressing NPL4mut. Lamin B and α-tubulin were used as markers for the soluble (S/N) and insoluble (pellet) fractions, respectively. F Immunoblotting of various p53 post-translational modifications (PTM) in A549 cells treated with CuET+/− (6 h) Etoposide (last 2 h). Etoposide was used as a positive control known to induce activating p53 PTMs. GCDKN1A mRNA levels following treatment with CuET (6 h) +/− Etoposide (last 2 h). Two different cell models were used: A549 transfected with siRNA against TP53 or control siRNA and U2OS cells compared to U2OS cells carrying a dominant negative p53 mutant (ddp53) (data are shown as mean ± SD, n = 3 biological replicates, ****p < 0.001, ***p = 0.01, **p < 0.01, ns non-significant).

Acknowledgments
This image is the copyrighted work of the attributed author or publisher, and ZFIN has permission only to display this image to its users. Additional permissions should be obtained from the applicable author or publisher of the image. Full text @ Cell Death Differ.