IMAGE

Fig. 1

ID
ZDB-IMAGE-230630-63
Source
Figures for Kanellis et al., 2023
Image
Figure Caption

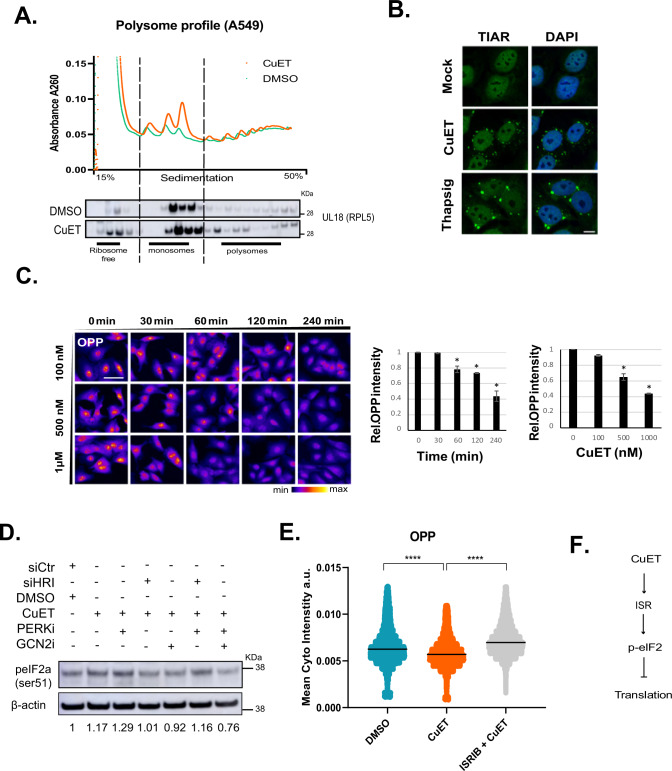
Fig. 1 CuET rapidly blocks protein synthesis.

A Upper panel: Polysome profiling of A549 epithelial cells following treatment with CuET for 1 h, lower panel: immunoblotting of the ribosomal protein RPL5 (uL18) in polysome profile fractions of A549 under the same experimental conditions. B Representative IF images of TIAR-containing stress granules after CuET treatment of A549 cells. The UPR inductor thapsigargin was used as a positive control. scale bar = 10 μm. C O-propargyl-puromycin (OPP) incorporation followed by high-content microscopy for the quantitation of translation rates in A549 cells treated with CuET or DMSO. 750–1500 cells were analyzed per experiment (data are shown as mean ± SD, n = 3 biological replicates, *p < 0.05) scale bar: 50 µm. D Immunoblotting of phosphorylated eIF2a (ser51) following treatment of A549 with CuET (2 h) +/–PERK inhibitor combined with siRNA against HRI or chemical inhibition of GCN2. Numbers below the blot indicate the signal ratio p-eIF2a/β-actin. E OPP incorporation followed by high-content microscopy for the quantitation of translation rates in A549 cells treated with CuET (2 h) +/− the ISR inhibitor ISRIB. 1000–2000 cells were analyzed per experiment (data shown as mean ± SD, n = 3 biological replicates, ****p < 0.001). F Schematic model connecting CuET treatment and translation.

Acknowledgments
This image is the copyrighted work of the attributed author or publisher, and ZFIN has permission only to display this image to its users. Additional permissions should be obtained from the applicable author or publisher of the image. Full text @ Cell Death Differ.