IMAGE

Fig. 5

ID
ZDB-IMAGE-230630-68
Source
Figures for Kanellis et al., 2023
Image
Figure Caption

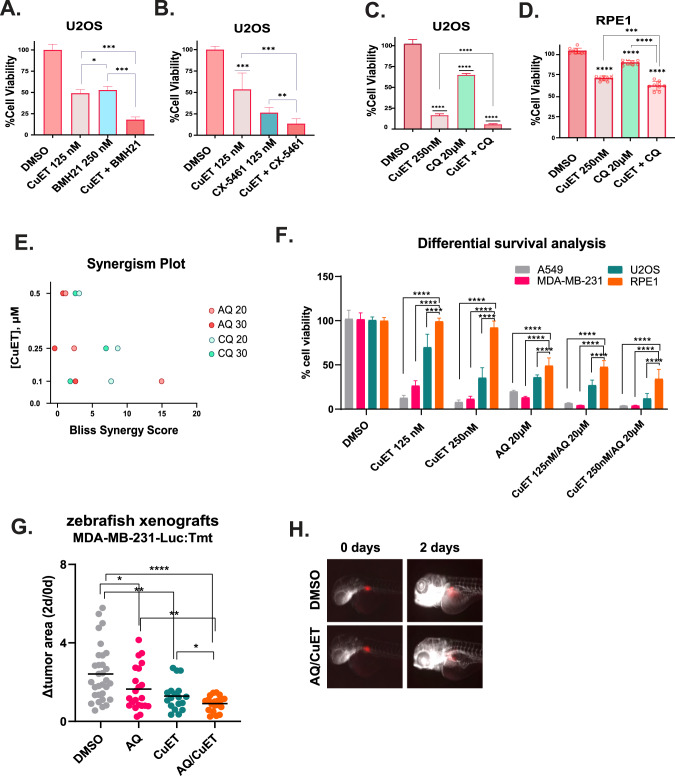
Fig. 5 RiBi and autophagy inhibition potentiate the cytotoxic effect of CuET.

A Survival analysis of U2OS cells treated with the synergistic pairs of CuET, BMH-21, or their combination (data are shown as mean ± SD, n = 3 biological replicates, ***p = 0.01, *p < 0.05). B Survival analysis of U2OS cells treated with the synergistic pairs of CuET, CX-5461, or their combination (data are shown as mean ± SD, n = 3 biological replicates, ***p = 0.01,**p < 0.01). CD Survival analysis of U2OS (C) or RPE1 (D) cells treated with the synergistic pairs of CuET, chloroquine (CQ), or their combination (data are shown as mean ± SD, n = 3 biological replicates, ****p < 0.001, ***p = 0.01). E Comparative plot showing the Bliss synergy scores of the dose pairs tested among combinations of CuET/AQ (amodiaquine) and CuET/CQ. F Differential survival analysis between three cancer cell lines (A549, U2OS, MDA-MB-231) and RPE1 treated with CuET+/− AQ (data are shown as mean ± SD, n = 3 biological replicates, ****p < 0.001). G Quantification of the transplanted fluorescent tumor area in zebrafish xenografts treated with DMSO vehicle, AQ, CuET, or their combination for 48 h. The end-point signal (2 days) is normalized to the initial one (0 days) for each sample tested (Δtumor area). H Representative IF images of xenografts treated with DMSO or the combination of AQ/CuET. Tumors composed of transplanted MDA-MB-231 cells are shown in red.

Acknowledgments
This image is the copyrighted work of the attributed author or publisher, and ZFIN has permission only to display this image to its users. Additional permissions should be obtained from the applicable author or publisher of the image. Full text @ Cell Death Differ.