
- Title
-
The anti-melanogenic properties of Swietenia macrophylla king
- Authors
- Mahendra, C.K., Ser, H.L., Abidin, S.A.Z., Khan, S.U., Pusparajah, P., Htar, T.T., Chuah, L.H., Tang, S.Y., Ming, L.C., Goh, K.W., Kumari, Y., Goh, B.H.
- Source
- Full text @ Biomed. Pharmacother.
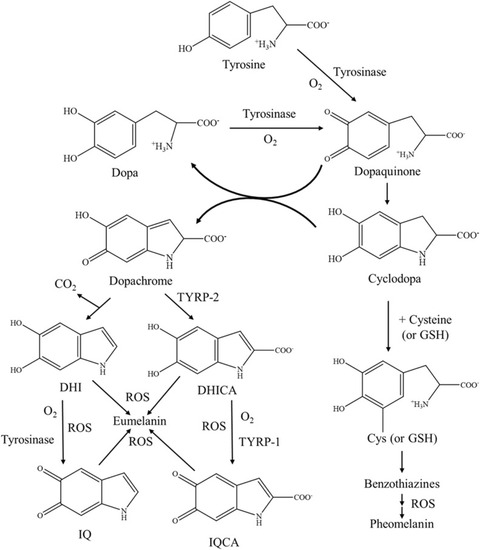
Fig. 1. The biosynthesis of eumelanin and pheomelanin in the melanogenesis process. Tyrosinase is the key enzyme involved in the oxidation of tyrosine to dopaquinone while TRYP-1 and TYRP-2 catalyze the final stages of eumelanin formation. The presence of ROS acts as an accelerator to the polymerization of indole units in eumelanogenesis. As for pheomelanogenesis, dopaquinone can react with thiol-containing products like glutathione (GSH) and cysteine to produce both benzothiazine and cysteinyl-dopa, leading to the formation of pheomelanin. |
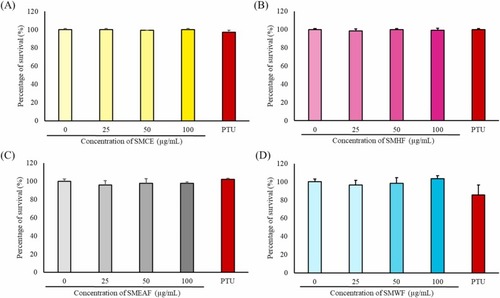
Fig. 2. Analysis of S. macrophylla extract and fractions toxicity on zebrafish embryos. The embryos were treated with various concentrations of (A) SMCE, (B) SMHF, (C) SMEAF, and (D) SMWF, with concentrations ranging from 0 to 100 μg/mL for 24 h. The toxicity of 40 μM PTU (positive control) was also analyzed (n = 3; * p-value ≤0.05, ** p-value ≤0.01; *** p-value ≤0.001). |
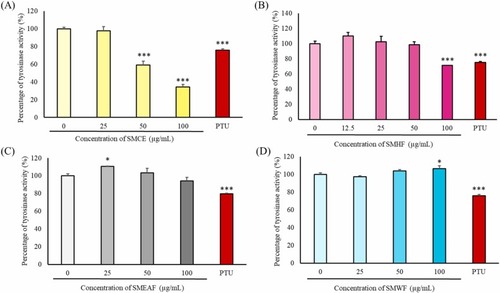
Fig. 3. Measurement of tyrosinase activity after treatment with S. macrophylla seed extract and fractions. Zebrafish embryos were treated with 0–100 μg/mL of (A) SMCE, (B) SMHF, (C) SMEAF, and (D) SMWF for 24 h. The harvested protein was then added with L-DOPA and the absorbance was measured using a microplate reader at 475 nm. For the positive control, 40 μM of PTU was utilized. (n = 3; * p-value ≤0.05, ** p-value ≤0.01; *** p-value ≤0.001). |
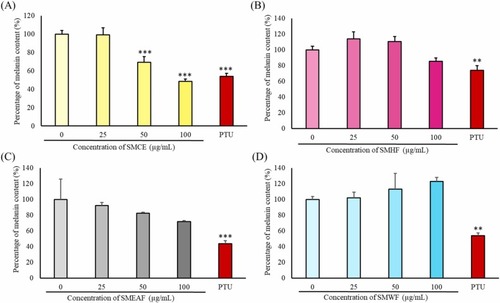
Fig. 4. The percentage of melanin content after treatment 0–100 μg/mL of (A) SMCE, (B) SMHF, (C) SMEAF and (D) SMWF for 24 h. As a positive control, 40 μM of PTU was used to induce a decrease in melanin content in the zebrafish embryos (n = 3 * p-value ≤0.05, ** p-value ≤0.01; *** p-value ≤0.001). |
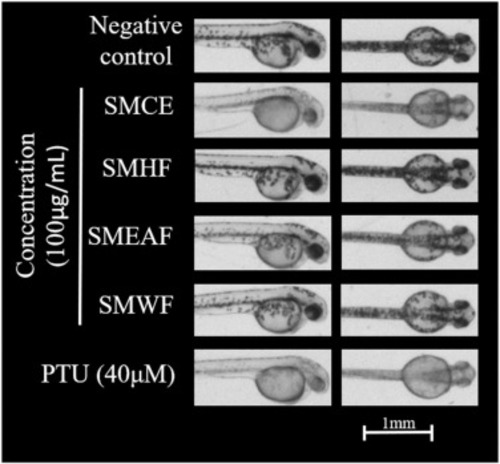
Fig. 5. Representative images of zebrafish embryos that were treated with 100 μg/mL of SMCE, SMHF, SMEAF, and SMWF for 24 h. PTU is the positive control in this assay (n = 50). |
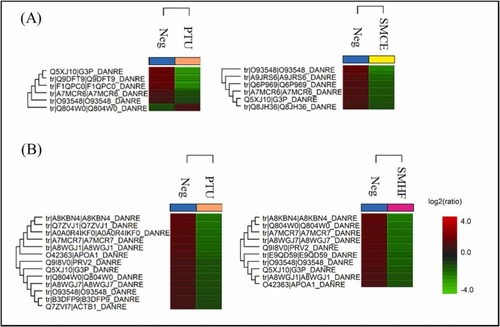
Fig. 6. Heatmaps on the proteins that were upregulated (red) and downregulated (green) in the zebrafish embryo by PTU, SMCE, and SMHF after 24 h treatment. (A) Comparison of negative control with 40 μM PTU or 100 μg/mL SMCE, (B) Comparison of negative control with 40 μM PTU or 100 μg/mL SMHF; (Neg: negative control, whereby zebrafish embryos were treated with only the vehicle solvent 0.5% (v/v) DMSO)(For interpretation of the references to colour in this figure legend, the reader is referred to the web version of this article.). |

Fig. 7. The gene expression changes of PSEN1 and PSEN2 in zebrafish embryos that were treated with PTU, SMCE, and SMHF. The negative control are embryos that were treated with only the vehicle solvent (0.5% v/v DMSO). (n = 3; * p-value ≤0.05, ** p-value ≤0.01; *** p-value ≤0.001). |
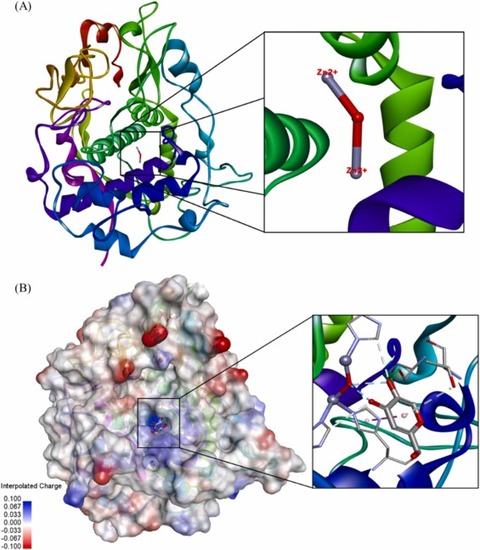
Fig. 8. Protein structure of TYRP-1 (5M8M) obtained from protein databank. (A) Image of the binuclear zinc active site for protein binding. (B) The binding pocket of ligands is colour coded with an interpolated charged surface (blue/red = positive/ negative).(For interpretation of the references to colour in this figure legend, the reader is referred to the web version of this article.) |
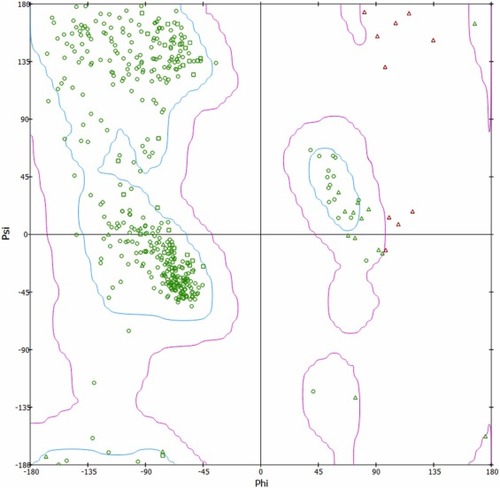
Fig. 9. Ramachandran plot of the protein (5M8M) obtained from Biovia Discovery Studio. The blue region represents the favored region, while the pink region is the allowed region. Green circles and triangles are protein residues that are within the favoured and allowed region, while the red triangles represent protein residues that are in the outlier regions.(For interpretation of the references to colour in this figure legend, the reader is referred to the web version of this article.) |
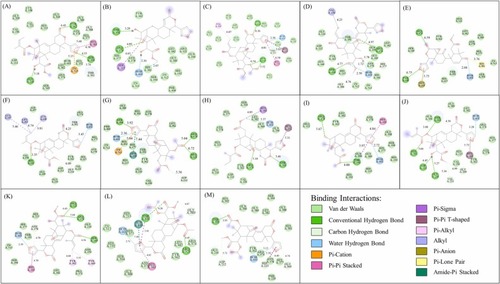
Fig. 10. Illustration of 2D binding interactions between limonoids and TYRP-1. (A-M) shows limonoid 2-hydroxyswietenine, 3-β,6-dihydroxydihydrocarapin, 3-O-tigloyl-6-O-acetylswietenolide, 3-O-tigloylswietenolide, andirobin, febrifugin, fissinolide, khayasin T, proceranolide, swietenine (14262276), swietenine (23891055), swietenolide diacetate (44575317), and swietenolide diacetate (98042567), respectively. (For interpretation of the references to colour in this figure, the reader is referred to the web version of this article.) |
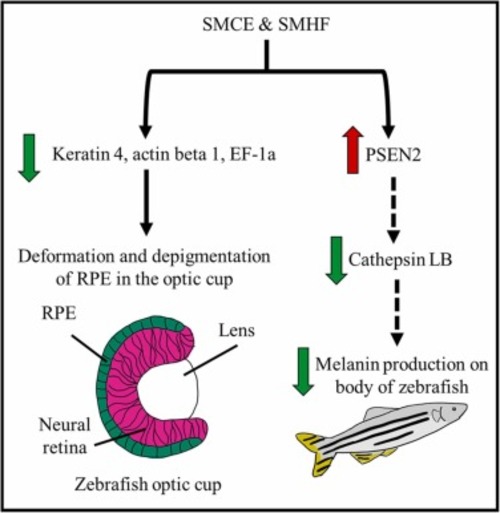
Fig. 11. The protein changes induced by SMCE and SMHF during the melanogenesis process of zebrafish. The decrease in keratin, actin, and EF-1a might have caused deformation and depigmentation of RPE in zebrafish embryos, giving rise to pale eye colour. In the meantime, the downregulation of cathepsin LB by SMCE and SMHF could be a factor in the decrease of melanin production in the body of the zebrafishes. The green arrows represent the downregulation of expression by either SMCE or SMHF, whereas the red arrows represent genes that were upregulatd. The dashed lines are proposed interconnected pathways that might have been activated during treatment. (For interpretation of the references to colour in this figure legend, the reader is referred to the web version of this article.) |
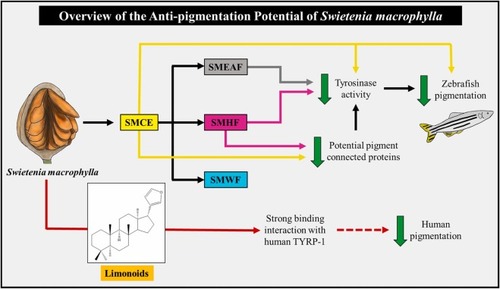
Fig. 12. An overview of the anti-pigmentation potential of S. macrophylla. The potential pathways mediated by S. macrophylla seeds in decreasing zebrafish tyrosinase activity and therefore reducing the melanin formed in the embryos. Pure limonoids from the seed too may potentially be a good inhibitor against human TYRP-1, decreasing human pigmentation. (Coloured lines indicate the influence of each extract, fraction, or compound against pigment formation. Yellow: SMCE; grey: SMEAF; pink: SMHF; Blue: SMWF; red: limonoids. The dashed lines represent possible effect on skin pigmentation. The green arrows represent downregulation.) (For interpretation of the references to colour in this figure legend, the reader is referred to the web version of this article.). |