
Image
|
Figure Caption
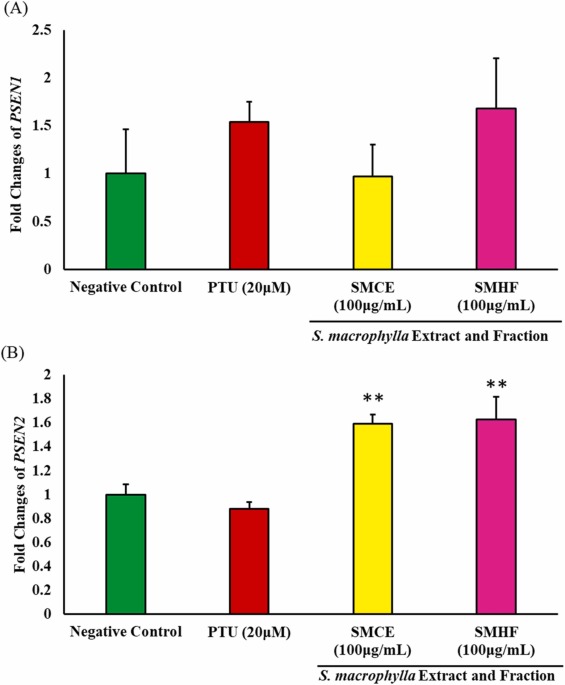
Fig. 7
Fig. 7. The gene expression changes of PSEN1 and PSEN2 in zebrafish embryos that were treated with PTU, SMCE, and SMHF. The negative control are embryos that were treated with only the vehicle solvent (0.5% v/v DMSO). (n = 3; * p-value ≤0.05, ** p-value ≤0.01; *** p-value ≤0.001).
Acknowledgments
This image is the copyrighted work of the attributed author or publisher, and
ZFIN has permission only to display this image to its users.
Additional permissions should be obtained from the applicable author or publisher of the image.
Full text @ Biomed. Pharmacother.