
FIGURE
Fig. 6
Fig. 6
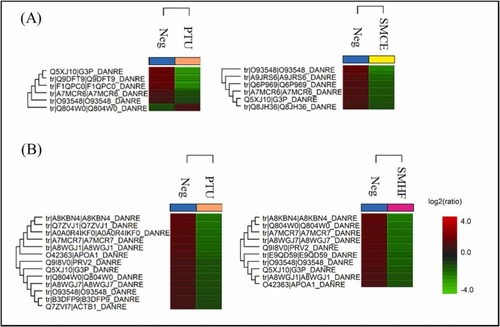
Fig. 6. Heatmaps on the proteins that were upregulated (red) and downregulated (green) in the zebrafish embryo by PTU, SMCE, and SMHF after 24 h treatment. (A) Comparison of negative control with 40 μM PTU or 100 μg/mL SMCE, (B) Comparison of negative control with 40 μM PTU or 100 μg/mL SMHF; (Neg: negative control, whereby zebrafish embryos were treated with only the vehicle solvent 0.5% (v/v) DMSO)(For interpretation of the references to colour in this figure legend, the reader is referred to the web version of this article.). |
Expression Data
Expression Detail
Antibody Labeling
Phenotype Data
Phenotype Detail
Acknowledgments
This image is the copyrighted work of the attributed author or publisher, and
ZFIN has permission only to display this image to its users.
Additional permissions should be obtained from the applicable author or publisher of the image.
Full text @ Biomed. Pharmacother.